Since the education industry started to invest in data, schools have been concerned that their data may be scattered; unavailable; not good or ‘clean’ enough to embark on strategic data projects.
Schools often feel they need to wait until the conditions are perfect. But by delaying, they’re missing an opportunity to gain actionable insights from the valuable data they already possess.
The best course of action is to always start with the data you have.
When you collect and consolidate your existing data sources, the data strategy conversation at your school will naturally start to increase its dimensions, its cleanliness… it’s possibilities.
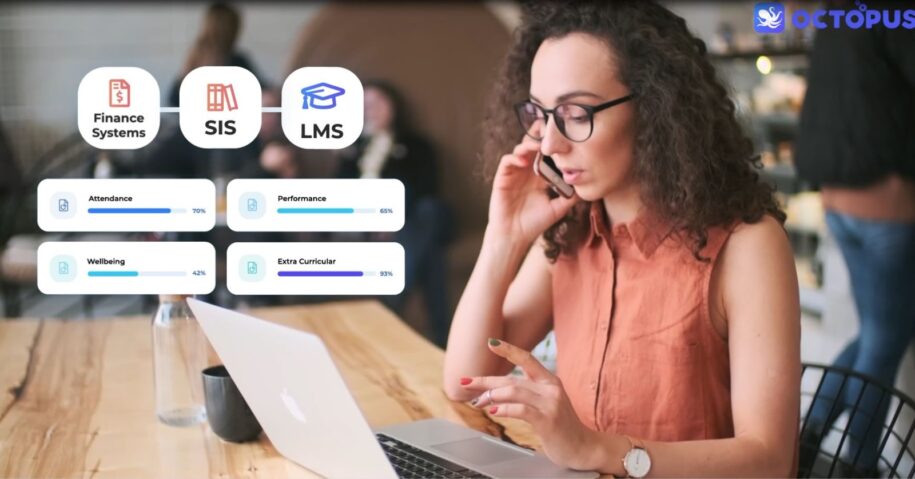
Just being able to align and compare teaching, learning and school operations data from disparate sources can give you massive value, before you even get to custom dashboards and dynamic visualizations.
Data analytics solutions are created with just this purpose in mind.
Education analytics software that is highly focused on the metrics your school cares about, and accessible to stakeholders like teachers, parents, Principals, education officials and administrators, and even students themselves, helps everyone make better-informed decisions.
The power in education analytics software
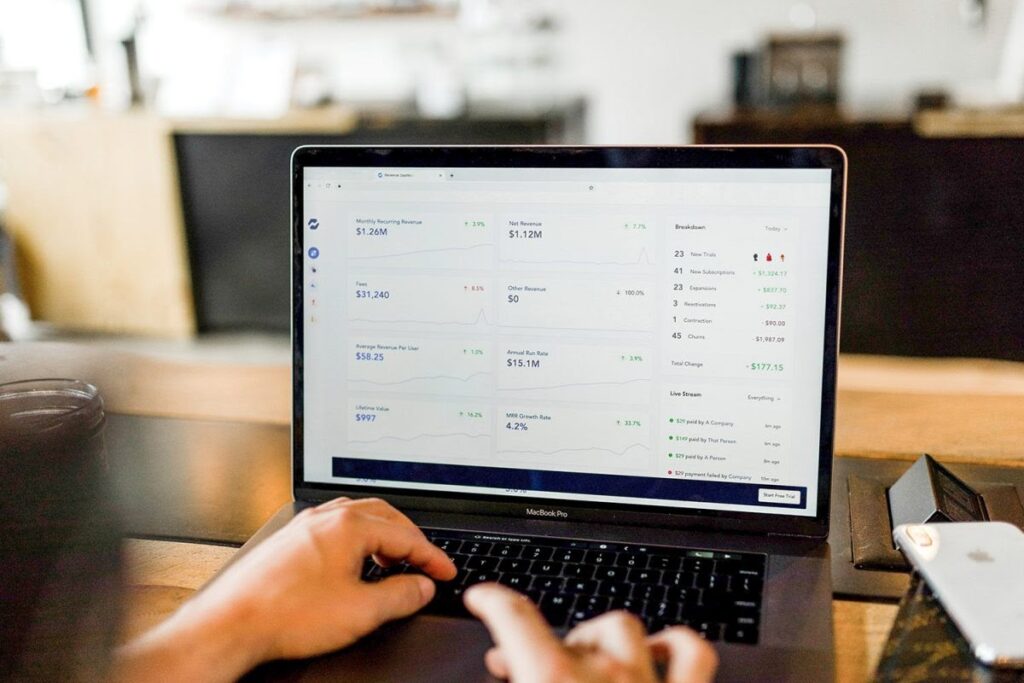
There is some value in accessing isolated analytical data sources, such as a spreadsheet of performance data. But having a single source of truth like a dashboard based on an analytical suite of software (sometimes called a stack) can make a complex, time-consuming process much simpler and more useful for everyone.
It can even operate in real time, eliminating or reducing reliance on (often out-of-date) biannual reports. Even better, you can share dashboards easily with key stakeholders.
If your performance data is in a separate place to your attendance data for example, and you want to analyse whether one is affecting the other, you’ll have to build spreadsheets by hand. This can quickly become complex and time-consuming on an individual student level, let alone for a class or year group. Then if you’d like to add in a third factor, such as welfare data, you practically have to start your project again!
Modern edtech tools like Octopus BI can tie all these factors together with dashboard analytics. Education analytics tools are more than performance dashboards. They can empower schools, parents and students to make decisions that will affect their learning in powerful, positive ways.
With dynamic data across a student’s entire school journey, you can make well-informed decisions to improve student learning outcomes, rather than guessing or leaving a student’s future to chance.
Example of a Student Dashboard in Tentacle:
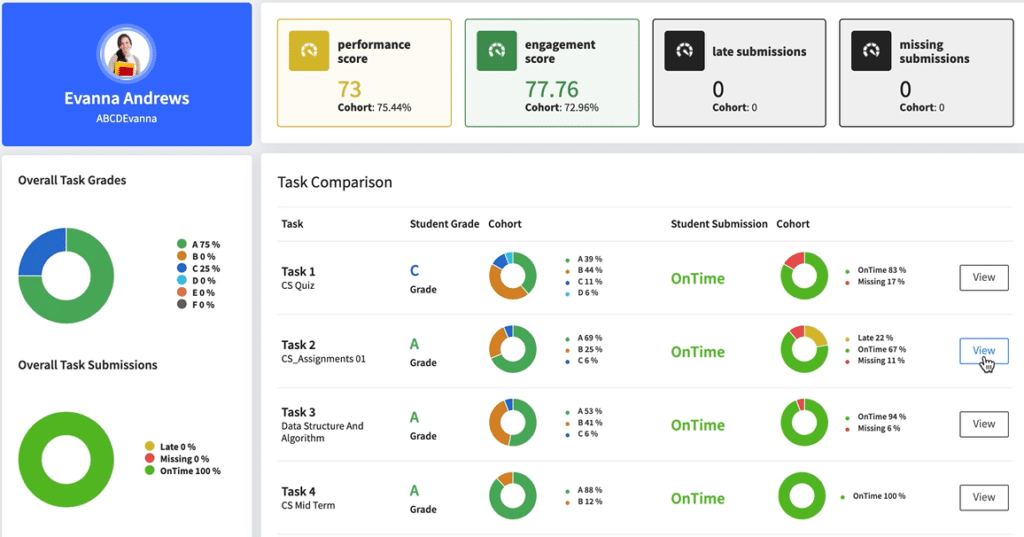
Carving this important data up into various views, such as a parent view of an individual student, a teacher view of a classroom, or a Principal or Year Group leader’s view of a cohort provides valuable levels of insight and analytics reporting.
This can give teachers the information they need to analyze and develop strategies for improvements in their classrooms and schools.
In the video below, Trevor Furness from Octopus demonstrates the possibilities of dashboards, including unifying data on performance, engagement and risk, and holistic student profiles with deeper levels of details and adjustable calculations available to suit different school’s requirements.
Now that you know how much value there is in dashboard analytics, let’s discuss five of the most common aspects schools like to measure in their default dashboards, and five things they’d like to measure if they had the chance, the infrastructure, or the expertise.
5 things schools currently analyze with education analytics software
1. Attendance and retention
Research into school attendance has shown that every day counts – every day a student does or does not attend class affects their later potential and capacity to learn. In order for schools to improve metrics like attendance and student retention rates, first they must track attendance and retention rates.
Further monitoring is then required as schools implement strategies like parental engagement and student incentives, in order for teachers, parents and students to truly see which strategies affect attendance and retention in positive ways.

2. Performance (Formative Assessment, Internal & External benchmarking)
According to UNESCO, there is worldwide concern about student learning outcomes and achievement. By monitoring and analyzing data on student performance in comparison to their own results and in comparison to benchmarks, teachers can learn whether students are progressing as expected. Statistical analysis of data can also highlight under-performance and under-serviced students so timely interventions can be implemented.
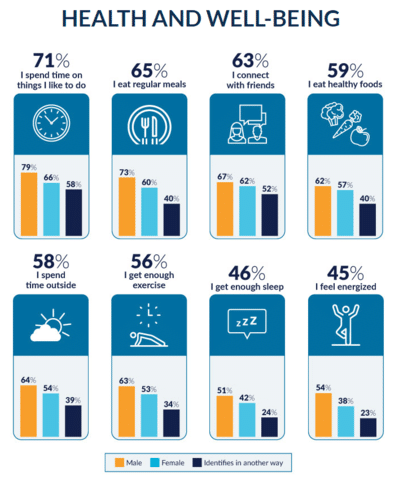
3. Behavior, Effort and Wellbeing/Welfare
In the 2020 NSW Student Behaviour Strategy, officials acknowledged the increasing body of evidence that shows student behavior, wellbeing and performance are intricately entwined. Teachers must understand which students are exhibiting positive behaviors and wellbeing, and which students are in need of support, safety or inclusion measures to improve their school experience.
For example, data analysis and research has shown that there is no evidence that suspension is an effective mechanism for modifying student behavior; therefore, alternative methods must be tested, monitored and analysed to honestly address challenging student behavior and support wellbeing.
4. Medical and Disability Needs
Schools need to be able to monitor and respond to the needs, performance, wellbeing and behavior of students living with disabilities. As with all students, those living with disability or medical requirements have a diverse range of needs in order to ensure their success.
Projects such as Inclusive School Communities in South Australia have seen that when students living with disabilities are included in the classroom, all students learn better. Inclusive strategies benefit from data collection and analysis; having access to clear, easy-to-interpret data will help decision makers identify the best path forward for each student as needed.
5. Sentiment
Self-reported student sentiment can be subjective and difficult to analyse without adequate tools to assist teachers to surface key actionable insights. Student sentiment analysis can gauge levels of interest, understanding and engagement among students, both in the active classroom, online classrooms, and in self-report reflection surveys.
Tools such as natural language processing and even facial sentiment analysis can augment instructors’ own perceptions, as well as highlight whether there are problem areas in the curriculum or teaching method that must be addressed.
5 things schools want to analyze with education analytics software
There are certain things that schools would love to measure with simple, clear dashboard analytics. Unfortunately, sometimes their data collection or quality is not good enough to accurately analyse or give predictions on these topics. It may also be the case that they require more premium data tools that are developing in these areas, if their existing infrastructure doesn’t extend this far.
These are areas where education data analytics tools are currently in research or development in order to better support students and teachers. If schools or higher ed institutions want to progress in these areas, they need strong tech partners to help them strategize and implement the necessary technology and data methodologies.
1. Risk
Schools are increasingly interested in measuring risk both in regards to OSHA and in student behavior. Government bodies frequently require a certain level of risk assessment and management for schools to comply with safety regulations.
It’s vital for schools to be able to identify students who are ‘at risk’ in a number of categories so these students can receive the support they need, and thereby make the entire school community a safer and more engaged place for all students.
Beyond this, education institutions have found, especially in 2020 and 2021, that uncertainty can have severe and adverse consequences on their operation and their students. With improved access and analysis of data, and increased ability to measure and analyse the potential for risk, both schools and students can better face and cope with risk and uncertainty in the future.
2. Growth
“Growth” and “growth potential” have become very popular subjects in discussing student development. It is often based on determining whether a student has performed better between two points in time – for example, has a student achieved expected growth between NAPLAN assessments. This is concerning growth to date, and there are many models that can be used to statistically determine student growth.
In predicting growth potential, however, there is a need for a more sophisticated data apparatus that can take into account a student’s achievement to date, identify which factors affected this performance, and where support or planning could affect a student’s growth in the future.
3. Expanded comparisons
The more data a school collects, whether about a particular student, cohort of students, or about general student performance and behavior, the more data points they have to draw comparisons from. This can inspire analysis and provoke thoughtful, evidence-based decision-making and planning.
Just one area of this kind of comparative data analysis that schools would like to dive into is comparing performance between internal and external assessments. One test score does not reflect a student’s total performance or potential. By comparing student results within their subjects, within their school, and within their local, state or national areas, discrepancies can be found, investigated and ideally addressed in order to provide better education for all students; it is only with sufficient comparison data that education officials and teachers can hopefully locate the cause of a discrepancy.
4. How students are developing confidence, grit and resilience
Student confidence has been shown to influence performance by as much as 12%; it can be a higher predictor of student success than self-esteem. The World Economic Forum has said that while the current education system is focused on IQ (memorisation and standardisation in particular), in the 21st century, schools are also an ideal place for teaching and learning EQ (emotional intelligence) and RQ (resilience).
The challenge in this area is that assessments of qualities such as confidence, emotional intelligence, resilience and more are often subjective, based on either student self-reporting or teacher assessment.
By equipping students and teachers with easy-to-use, accessible reporting tools, and clear visualisation results from those reports, both teachers and students can ideally come to a better understanding of how to measure such qualities, and the kinds of strategies and support that can improve them over time.
For example, if a student’s self-reported measurement of confidence increases over time, an analysis of their complete student profile over that same time may reveal which factors most strongly affected this confidence gain; this can highlight the necessary areas where other students may require support or intervention to build their confidence, too.
5. Collecting and analyzing data from wearable tech
Many consumers today have invested in wearable technology like smart-watches and FitBits; this extends to students both in higher education and in K-12. As these devices become more prevalent among students, schools are interested in the data these devices provide about students’ level of physical activity and how that may impact their mental and emotional capability. There are benefits and challenges to the use of this data, especially in privacy, security, cost, and both teacher and student attitudes toward technology and physical activity.
For example, in one school district in the US, parents protested the use of wearable technology to measure students’ heart-rates, on the basis that students were receiving failing grades for not achieving target heart-rates. This demonstrates a potential misuse of data or misunderstanding between parties.
Another aspect of wearable technology is in the use of VR headsets for teaching and learning, and the data available there about whether such methods positively affect student engagement, learning and even empathy with the subject matter.

Dashboard analytics can help schools make better decisions
Data will play an important role in the future of the education industry. Schools that not only collect their data, but consolidate it into easy-to-access and easy-to-use ways will have an advantage in evidence-based, data driven decision-making.
Technology should make life easier and better for both teachers and students, not harder. Sometimes when talking about the ‘future of education’, it may seem like fifty, twenty or ten years from now. But with sophisticated data analytics tools and dashboards, the future of education can be a reality today.