OctopusBI Helps Playford International College Reimagine Teaching and Learning
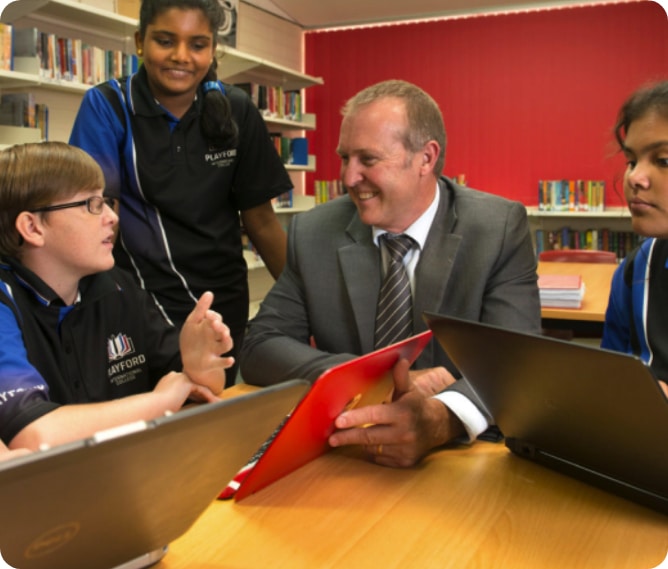
Working with one of the broadest cultural, language and learning needs diversity in South Australia, Playford International College puts community engagement at the heart of its holistic teaching and learning approach.
Playford International College required a data analytics platform that was intelligent, visual and agnostic so it would integrate with any software solution, in particular Canvas.
1,000 Users
Elizabeth, SA, Australia
Started 2019
Key challenges:
School leaders spending too much time sifting through large spreadsheets
No automated alerts to students, staff or parents when attendance or academic parameters had been achieved
Double handing data sets, wasting time and money on manual handling
Visualizing Student Data through Octopus BI Dashboards on AWS for Playford International
Playford International sought to improve their data analytics skills without developing a proprietary system. They worked with AWS partner Octopus BI to deploy their SaaS solution, which is hosted on AWS and intended for educational establishments. Through the use of visual dashboards, Octopus BI specializes in facilitating the accessibility and comprehension of complicated educational data. The system gathers information from several student and school databases and stores it in Amazon S3 buckets at first. The data is transformed using Amazon Athena and Glue and then saved in Amazon Redshift tables for in-depth examination and visualization. insights through data visualizations is made easier with Octopus BI. For initial data storage, the system uses Amazon Simple Storage Service (Amazon S3) to gather instructional data from multiple sources. Then, Amazon Athena and Glue transform this data and save it in Amazon Redshift tables for in-depth analysis and visualization. Administrators and leaders at schools can view near-real-time data dashboards on desktop or mobile devices through the Octopus BI platform. Numerous pieces of information are displayed on these dashboards, such as exam results, student statistics, learning management system data, etc.
“As a rapidly growing school we need the data to work for us.
We required an automated, technology agnostic and intelligent data system that presented the right data to the right people in a visual manner”
Nathan Cini, Executive Director of Digital Learning and ICT Infrastructure
Results
New academic report generated for each student every day, rather than waiting until end of term
Students, parents, caregivers and teachers now access dashboards daily
Live data allows for meaningful conversations about student progress and early intervention
“Invest more time in making your data work for you, so your staff don’t have to work for the data”
Nathan Cini, Executive Director of Digital Learning and ICT Infrastructure
Request a Demo
Contact us to get a demo of OctopusBI to identify ways you can convert education data into insights.