Helping teachers better plan a holistic approach to student learning
Launceston, Tasmania
1,100 students
Scotch Oakburn College is an independent, open-entry, Early Learning to Year 12, co-educational day and boarding school, in association with the Uniting Church in Australia.
"Teachers now have access to a dashboard for their whole class and a student dashboard...visually tracking PAT, NAPLAN and A-E results.”
The schoolis committed to ‘Creating the Future’ within a caring, supportive and inclusive community that provides an exceptional holistic education that enables every student to maximise their potential.
The Challenge
The school was facing data challenges commonly faced in the education sector.
“We had lots of data but it was stored in many different places and often in a format that was not easy to interpret,”says Virginia.
Attempts had been made to put the relevant data into spreadsheets that teachers could use but this was incredibly time consuming for those creating the spreadsheets.
Having the data stored piecemeal made it difficult to retrieve and to triangulate. There were also ‘holes’ in the data they were difficult to spot.
The Solution
Scotch Oakburn considered a number of factors in selecting a long term data strategy partner.
Flexibility was the first.
“We wanted a partner who had experience but was willing to work alongside us, to make suggestions and to listen to our needs,” says Virginia.
“We needed the ability to make changes on request as we generated new data or wanted to change the way existing data was presented.
We also needed a solution that was affordable”.
Embarking on their data journey, Scotch Oakburn thought a lot about what they wanted to know, what data they had and how they wanted to see the data being used tosupport student learning and holistic student reporting, in conjunction with their learner profile initiative.
The school has 10 learning attributes that help focus learning in a way that leads to more deliberate and considered recognition of the whole student. They want students, parents and our broader community to become more familiar with these attributes and their relevance for student learning.
Visualizing Student Data through Octopus BI Dashboards on AWS for Scotch Oakburn College
The goal of Scotch Oakburn College was to improve their data analytics skills without developing an internal solution. They collaborated with Octopus BI, an AWS Partner, to use their software as a service (SaaS) solution for educational institutions, which is based on Amazon Web Services (AWS). Delivering insights through data visualizations is made easier with Octopus BI. For initial data storage, the system uses Amazon Simple Storage Service (Amazon S3) to gather instructional data from multiple sources. Then, Amazon Athena and Glue transform this data and save it in Amazon Redshift tables for in-depth analysis and visualization. Administrators and leaders at schools can view near-real-time data dashboards on desktop or mobile devices through the Octopus BI platform. Numerous pieces of information are displayed on these dashboards, such as exam results, student statistics, learning management system data, etc.
The Results
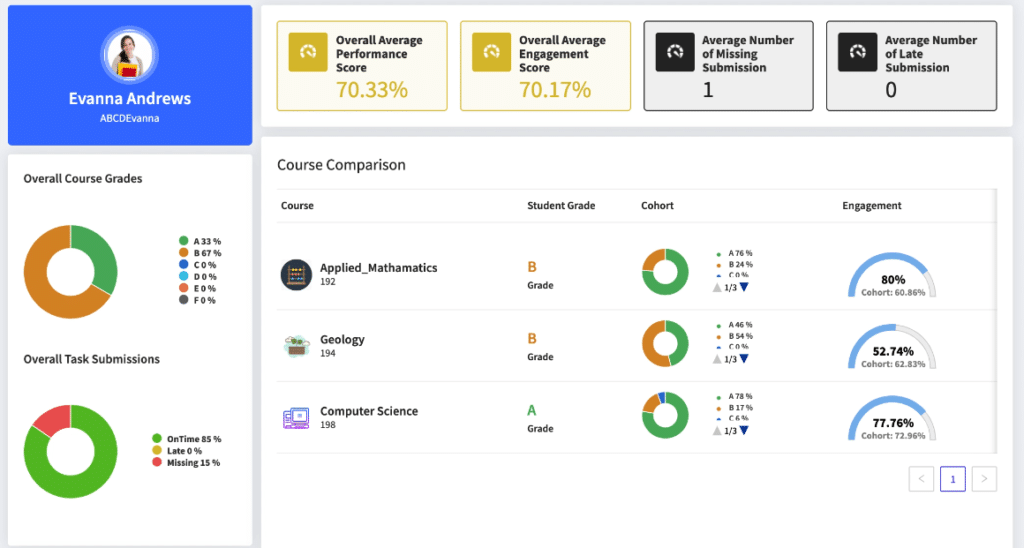
Teachers now have access to a dashboard for their whole class which, at a glance, has a heat map of triangulated academic data showing strengths and areas for development for each student in their class.
Example Individual Student Dashboard
As well as other data on the class dashboard, there is a student dashboard which drills down even further and enables visual tracking of academic data – PAT, NAPLAN and A-E results.
“Teachers are now better able to plan for the range of abilities in their class. On a pastoral level, a better ‘picture’ of the child can be seen to better support each student.”
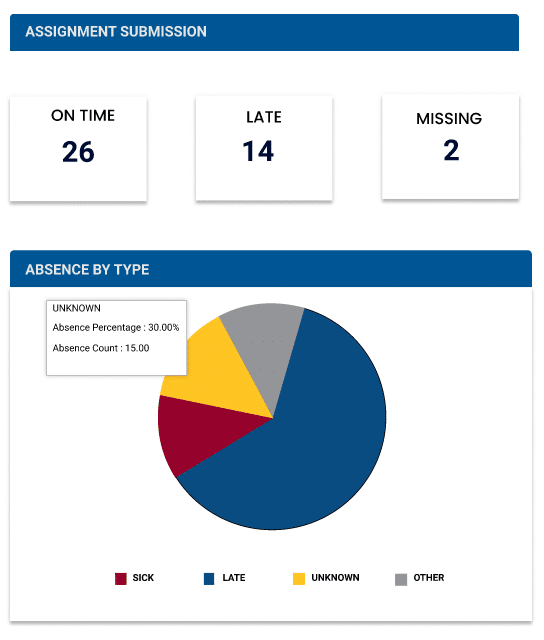
Student Assignment submission data compared with Absence Rates visualized in Tentacle Dashboard
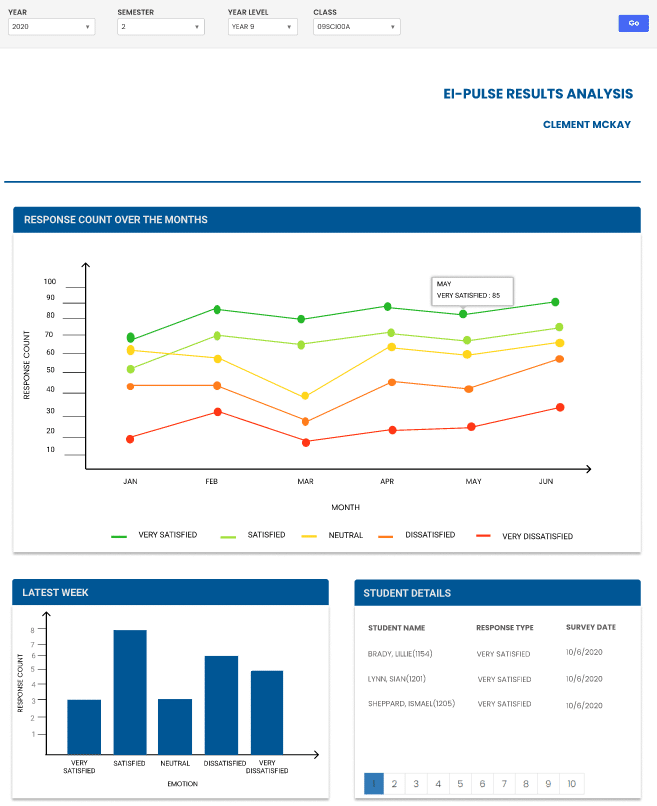
Student wellbeing and engagement trends over time from EI Pulse
Working with Octopus developers to design the dashboards, “we need to always be thinking of making the data tell a story that makes it accessible to ALL teachers, not just those who love numbers and spreadsheets,” says Virginia, adding that the use of graphics and colour is key.
Only teachers at the school currently have access to the Dashboards but the school is considering the value of opening them up to parents and students.
Request a Demo
Contact us to get a demo of OctopusBI and start converting education data into insights.