Informing parent teacher conversations and early intervention
Melbourne, Victoria
800 students
Strathcona Girls Grammar is a medium sized K-12 school. It aspires to be a nurturing learning community that develops intellectually curious, optimistic, life-ready young women who are empowered to shape their future in a rapidly changing world.
“We can see how students are tracking over time to identify changes in performance that may warrant further investigation and intervention.”
The Challenge
Strathcona collected a lot of data but it was difficult to access and use to inform decisions.
“Not all staff who should have access to the data could view it and it was not in a format that was easy for staff to interpret,” says Ross Phillips.
The Solution
The school needed a partner who really understood education and the complexities of dealing with educational data, not just performance data for a business.
“In our initial conversations with Octopus we felt they understood this and understood our needs,” says Ross.
Visualizing Student Data through Octopus BI Dashboards on AWS for Strathcona Girls Grammar School
With no internal solution, Strathcona Girls Grammar School looked to enhance their educational data analytics. To find a SaaS solution specifically designed for educational institutions, they contacted Octopus BI, an AWS partner. With its intuitive dashboards, Octopus BI aims to simplify the access of intricate educational data. First, the data is stored in Amazon S3 buckets after being collected from multiple student and school databases. Data transformation is done with Amazon Athena and Glue, and for analysis and visualization, the transformed data is kept in Amazon Redshift tables. Teachers can see near-real-time dashboards by logging into an Octopus BI platform from their devices. educational data. First, the data is stored in Amazon S3 buckets after being collected from multiple student and school databases. Data transformation is done with Amazon Athena and Glue, and for analysis and visualization, the transformed data is kept in Amazon Redshift tables. Teachers can see near-real-time dashboards by logging into an Octopus BI platform from their devices.
The Results
Heads of Departments, the Pastoral Team and Senior Leadership now all have access to Octopus dashboards.
“We are developing this so that every teacher will be able to see the student dashboards for just the students they teach,” says Ross.
Conversations with parents are much more informed, such as when a parent feels their daughter’s performance has dropped, or that she is not doing as well in one subject as another.
“We’re using data to add to the human story and engagement, not reduce it” – Ross Phillips
“Subject selection is also much more informed by the data we have on the students across the board, that we can now see on one screen.
For example, we can detect trends such as year 10 Mathematics performance and the likelihood of students wanting to leave Mathematical Methods in Year 11”
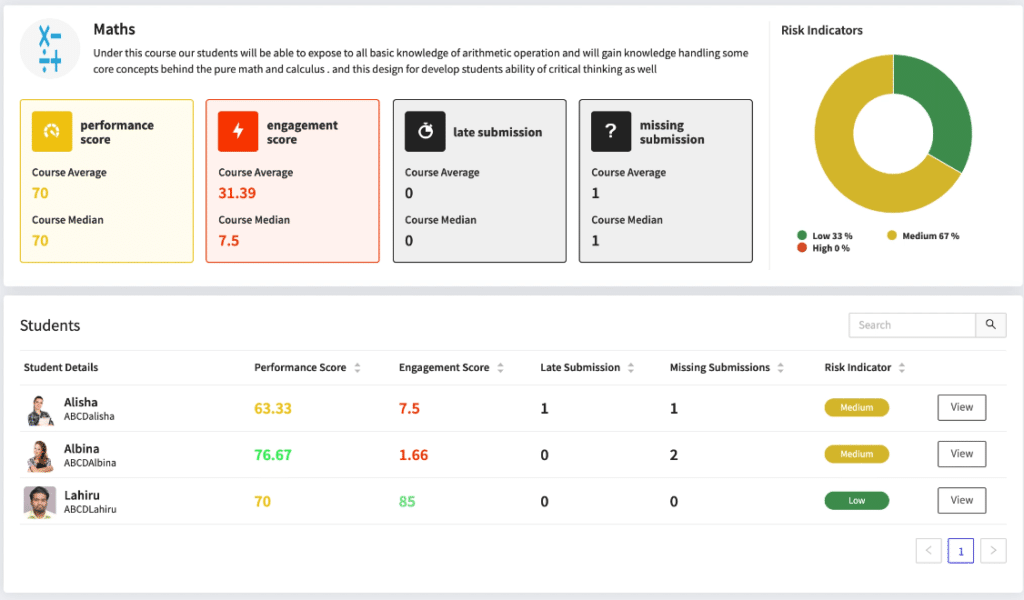
Example class and cohort dashboard for Maths:
“We can also see how students are tracking over time to identify changes in performance that may warrant further investigation and intervention,” says Ross.
It is possible to compare different classes of the same subject and track trends and characteristics across the board.
Request a Demo
Contact us to get a demo of OctopusBI and start converting education data into insights.