Moving from Learning management to the data and learning analytics space has allowed for a renewed perspective on schools and their data strategies in a rapidly evolving education context. Here are 6 observations I’ve made after my first 6 months in my role at Octopus BI.
Observation 1 – Expectations of Parents have changed and the twice yearly report is not as relevant as it was in the past:
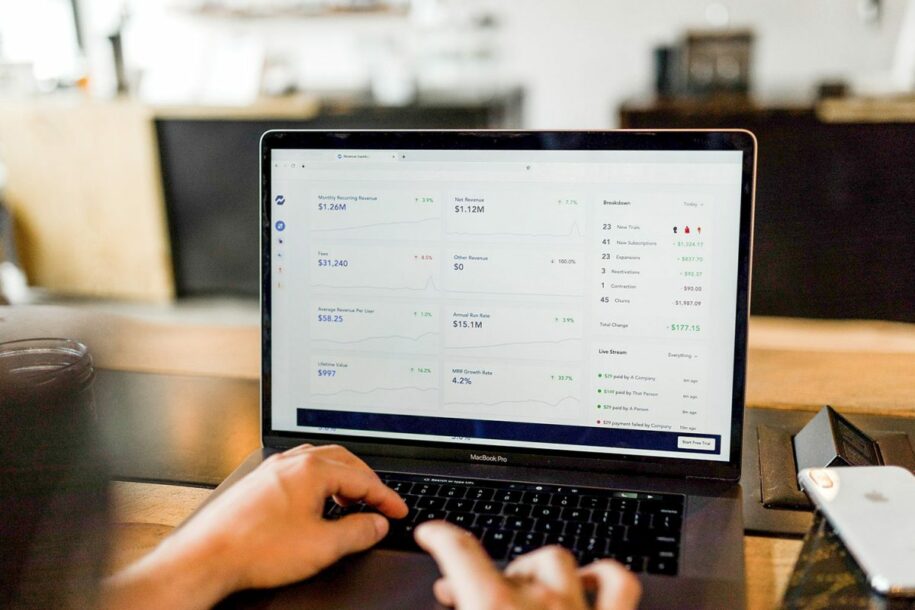
It goes without saying that parents have become (like the rest of society) a highly connected group of individuals with the mobile device acting as the constant electronic companion by their side. This has created a curious gap between the way they receive information about much of the rest of their lives and the way they receive information about their children’s learning. One being instant, push message or alert, and the other being a 6 month gap between the last pdf or paper report, and the next one.
Schools are struggling to change the timeliness of that interaction and the obvious benefits for student learning with regular and early intervention strategies. There is an enormous opportunity for early intervention by allowing notifications and any time/any device interaction with the data.
Observation 2 – Very few schools have a handle on the data they have:
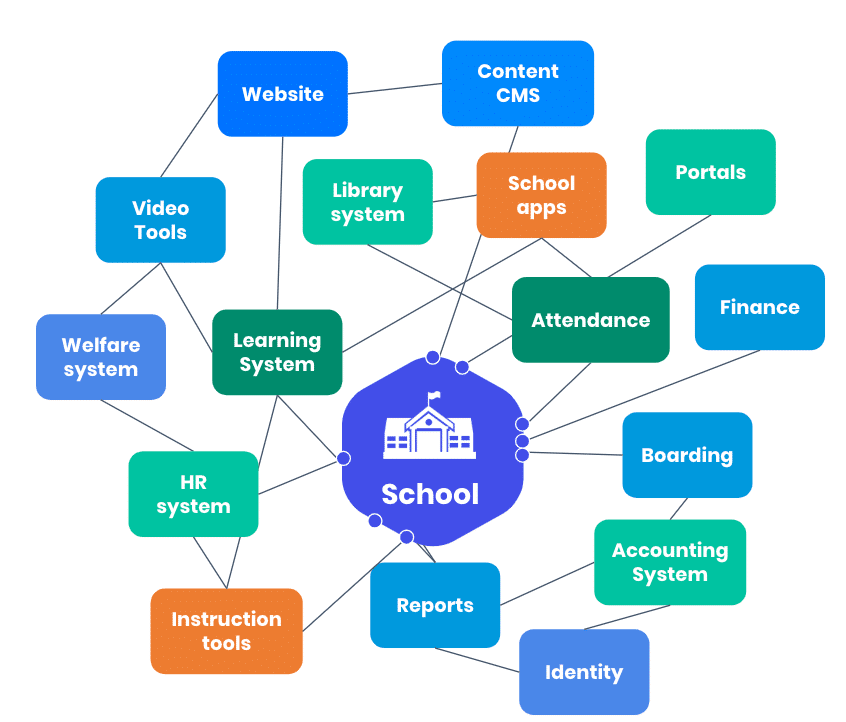
Software has become cheaper to produce and faster to release resulting in the rapid increase of school’s investment in these tools. Once a single system, school ‘operations’ has now become an entire ecosystem of digital tools managing everything from the library, canteen payments and significantly; reporting and assessment.
Whilst schools recognise is that each of those tools collects an increasingly rich data set, many struggle with navigating the complex interaction between these tools to get a picture of teacher and student success factors and this is made worse by the next observation, that:
Observation 3 – Teachers don’t have the time to wrangle information from multiple sources
A primary school teacher manages upwards of 20 students and a high school teacher manages upwards of 100 students. If you multiply this number by the number of software services inside a school (between 5 and 50) you have a very high number of places that a teacher needs to look to get a sense of student performance indicators and students who are at risk of underperforming. It’s not possible for this kind of work to occur every day and as such, when students begin to hit risk indicators, it takes a while to recognise and even more time to do anything about it.
Observation 4 – Downloading a free trial of something poses real governance issues
There are lots of tools that exist and that are being downloaded every day that allow schools to try and patch some of this diverse information together and as a result schools are beginning to recognise the Governance risk associated with such behaviour. Working with a reviewed, registered data partner allows school executive teams to agree on the information that is being collected, how it is being visualised, and most importantly the distribution list of who is allowed access to view this sensitive information.
Observation 5 – You don’t need to have the entire long term strategy mapped out to take advantage of your data now
Waiting another 6-12 months to try and get a long term plan together will cost the school unnecessary time. Our observations are that the data volume and quality in most schools needs to be improved over a 12-18 month period to really begin making long term impact, so I’d suggest you start with what you have.
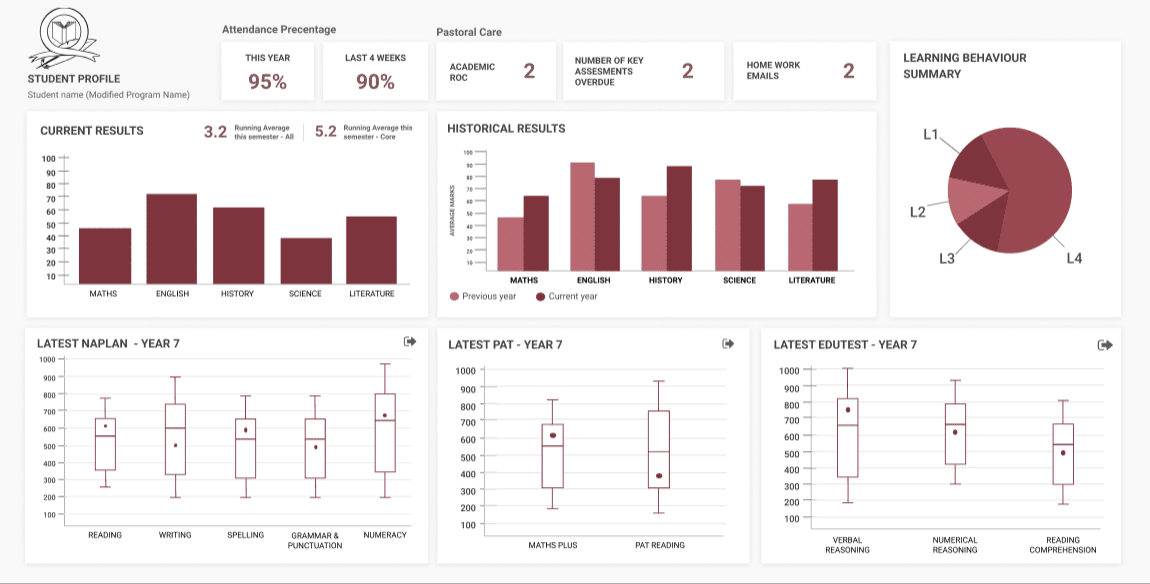
The most common starting point for schools in the Octopus community is with Student Profiles and Year coordinator/Subject coordinator dashboards. This allows the culture shifting process to begin, teachers and parents to become more data informed and more literate in impacting future iterations of the dashboards.
Observation 6 – There is an enormous opportunity for schools to think about getting even deeper insights on the information they have by including opinion and sentiment data.
Once the empirical data has been collected, normalised, visualised and distributed, the next part of the journey is for schools to begin collecting sentiment and opinion data through managed surveys. Imagine the possibility of allowing opinion and experience data to interact with assessment and attendance data. A great opportunity for schools driving continuous improvement.
What observations have you made about the opportunity to leverage information and data at your school?
Would you like to know more about how strong data strategy partners can help you manage the data you already have while you plan a medium term strategy?
Get in touch trevor@octopusbi.com
Trevor Furness is the Chief Revenue Officer at Octopus BI and has spent almost 20 years in the education industry starting as a classroom practitioner. For the last 15 years Trevor has been working with schools and businesses driving innovation in teaching and learning through educational technology
Octopus BI is a leading Australian Data and Learning analytics company focusing on the K-12 space. Octopus connects to your existing data sources, Visualises in beautiful and easy to read dashboards and helps you publish those dashboards in your existing SIS, LMS, Portal or website.