
Thirteen years ago, the first iPhone was released and society as we knew it began to change.
Bringing all forms of communication – calls, text, emails, facetime, and social networks – into one tool that could be used by an everyday person, the iPhone allowed us to communicate at an easier and faster rate.
Alarm clocks, calendars, notepads, in-car GPS devices, cameras, MP3 players, even flashlights were replaced by this one clever invention. Just look at the impact it had on our data usage.
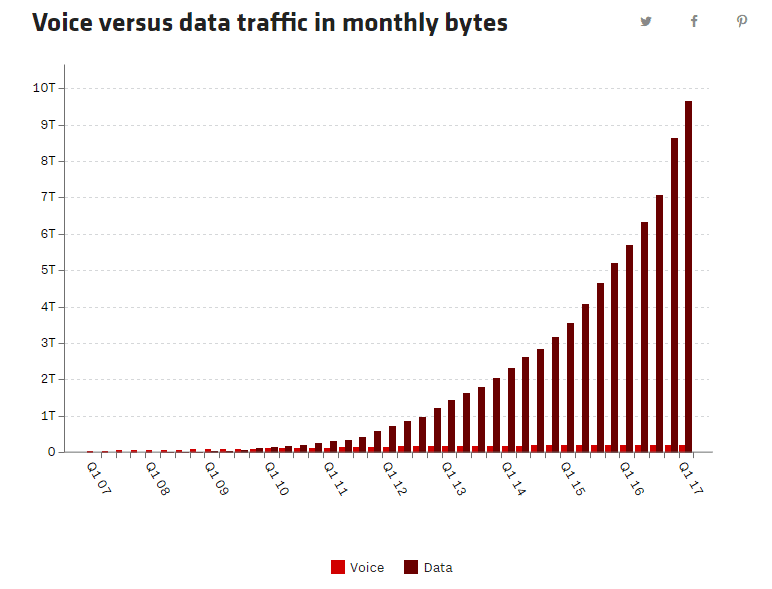
Source: Vox.com
For some years now, data analytics has been viewed as the ‘next frontier’. A promised land beckoning huge influence on industry and society.
But how close are we to that ideal being a reality?
If you look at the latest Feb 2021 Gartner analysis of data analytics and BI platforms, all the vendors in the leadership quadrant offer commercially viable, platform-agnostic, mature data science platforms.
To get tangible and timely benefits into the hands of most businesses, let alone consumers, however, they require manual work or the help of a specialist. They’re not user-friendly in terms of speed to outcome or usability.
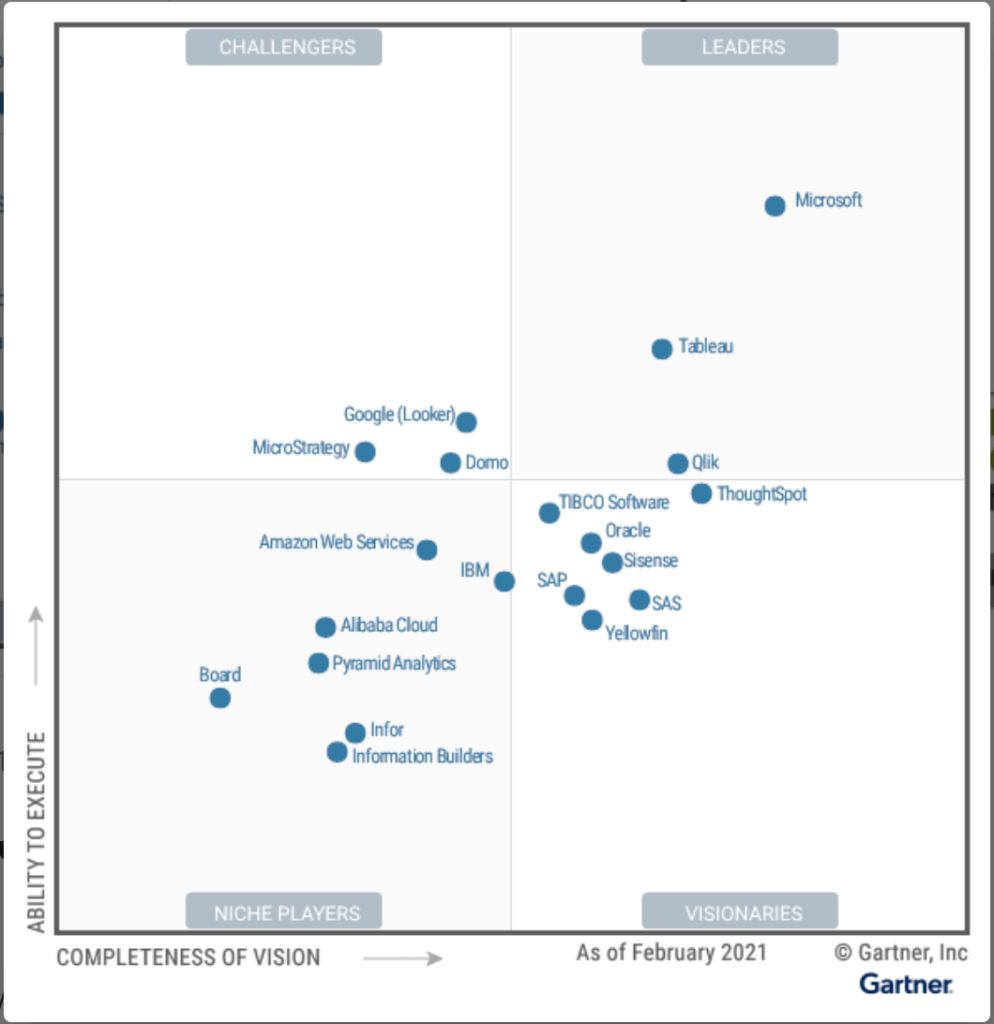
Source: Gartner.com
Data and predictive analytics has of course had huge benefits for industries such as transportation and supply chain, minimizing delivery times, maximizing production volume and enabling huge cost savings.

Across the board however, business impact is still relatively low. If the data analytics nirvana is an iPhone, we’re still a PDA.
I’m constantly thinking, how can we take this specialist industry and make an iPhone out of it? Like what Canva has done for graphic design, or what Xero has done for bookkeeping or Google for information indexing.
What does the iPhone of analytics look like? What problems is it solving for everyday people across industries? How can we shorten that time period and make it accessible so that powerful insights are at everyone’s fingertips?That’s the future. It’s all about how we’re going to get there.
No one cares about data; they want outcomes
Organisations today are collecting more data than they ever have. This represents a huge opportunity to inform better business decisions.
Talk to any senior executive; they’re not interested in raw data. They want to know if the decision they’re about to take is the right one or the wrong one for the company.
The problem is, organisations are investing heavily in data collection and data preparation stages at the expense of the final critical deployment stage. Some call this ‘last mile analytics’ – the missing link between building models and getting the most out of them.
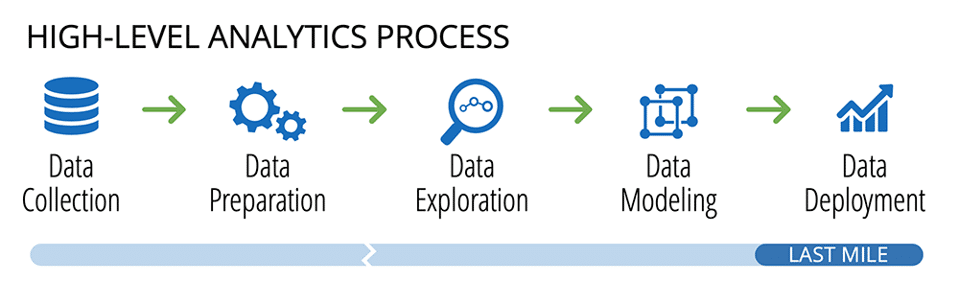
Source: Forbes.com
It’s a major problem according to 77% of companies surveyed by NewVantage partners, who noted people and process (95%) are the bulk of the challenge—not technology.
This is why my team at OctopusBI consider end-user experience from the outset, optimising analytics outputs with customer input as we go in a continuous learning mode.
We start with these three principles:
- Build from the ground up
Solution engineers gain an understanding of the domain expertise of an organisation and the decisions end-users are facing. They involve the organisation in the design process. It is not only about the accuracy of the model but also understanding how the solution can create behavioural change that delivers business value. No model was built perfectly the first time. - Integrate into existing operations
To deliver business value, analytics tools can’t be onerous. They need to work with ratified existing business processes and workflow. Dashboards that visualise insights within already mandated systems are a great example of that. They increase return on existing investment and reduce time to adoption.
“Integrating data initiatives into everyday workflows that put insights at the right people’s fingertips is the key to fostering a data-driven culture and the many benefits it brings.”
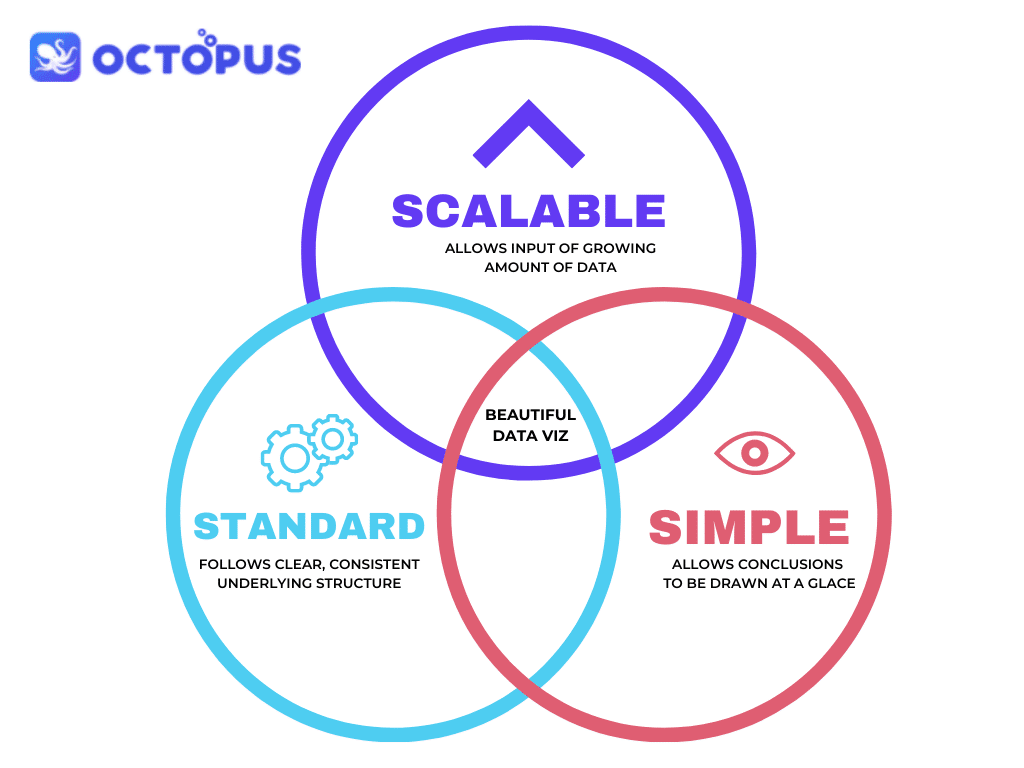
- Present in easily digestible ways
Data visualization brings business intelligence to life, helping everyday people quickly comprehend insights from data, spot trends, outliers and patterns. 90% of the information transmitted to the brain is visual (MIT). With more processing power, end users are more likely to find timely information (without needing the help of an IT specialist) than those who rely on text based reports.
These principles are important to any successful data initiative.
Aligning on strategy across the business and what you want the analytics to achieve before working backwards may sound simple, but it is often overlooked.
Impact over output – bringing BI to education
I am driven by impact.
My work as a systems engineer in the education sector showed me:
- the transformative power of education in people’s lives and
- the huge opportunity for education institutions to benefit from data analytics.
They collect tonnes of data using different systems, but when they have to use it for decision making, they don’t have capacity or the capability to get that done.
As a parent, I wait three to six months for an outdated report about my child’s learning and growth.

When you think about the real-time notifications we get about everything else in our lives day to day, that’s just not good enough. And we can’t expect teachers, who are already overstretched, to provide time-critical insights.
A useful analytics solution that improves learning outcomes, while making life easier for teachers, students, parents and school leaders, is what we set out to build five years ago when I founded OctopusBI.
Working in close partnership with schools, we complete that elusive ‘last mile’: allowing them to monitor class and student progress, continuously report, engage parents, enact early intervention strategies and more.
I’d like every school in Australia to have a business intelligence or data analytics platform because the value of the right technology is going to enable them to transform into a smarter school.
An outcomes-focused approach to data initiatives is key to unlocking the power of data analytics for any sector.
It’s only by focusing on impact that we will evolve from the ‘PDA’ to the ‘iPhone of analytics’, and positively revolutionise education, along with many other industries.