When I talk to customers and schools about their data projects lately, overwhelmingly they are interested in student welfare.
Schools are becoming more aware of the opportunity to measure student welfare, particularly through self-reporting mechanisms, to help track and monitor impact.
This is fantastic, but there’s still a huge gap between using student welfare and wellbeing data diagnostically to inform actual teaching and learning.
There’s never been a more compelling time to get this right.
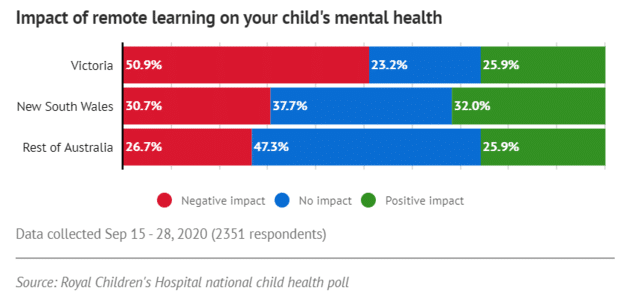
As I write this, Greater Sydney, and Victoria, are facing the likelihood of an extended lockdown due to COVID-19.
Vocational, higher education, and K-12 school leaders, teachers, students and families are grappling with disruption to classroom teaching and learning, and the requirement for much deeper and longer use of technology tools to support the day-to-day.
Macro circumstances like this remind us that student emotional and social wellbeing is a vital part of learning – it cannot be thought of as a separate issue any longer.
Here’s what we know: face to face instruction is not guaranteed, and when there’s deep irregularity it does impact student well being.
There’s two sides to that coin:
- One side is the students that thrive when they’re not face to face.
- The other side is the students that don’t thrive when there’s a huge amount of change.
Not another data collection point
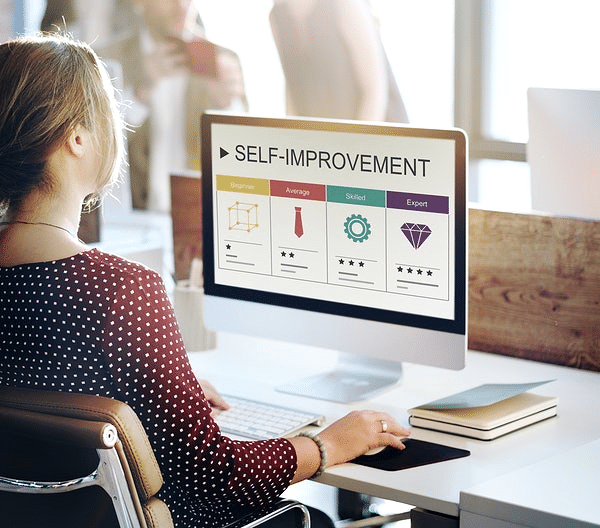
I’ve seen a few tools crop up to help schools manage empirically the changes in student self reporting data around welfare and self.
Some schools I work with are collecting regular student surveys around things like relationships, sleep, relaxation, exercise, or stress levels.
The tools they’re using range from simplistic ones where younger students literally will provide an emoji to answer ‘how are you feeling today?’, to more sophisticated surveys, quizzes, rubrics and ePortfolios.
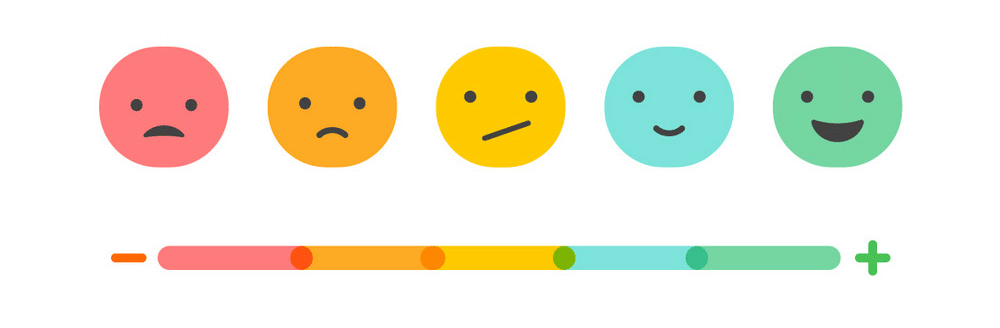
Source: SchoolBox – What does Self-Assessment and Self-Reflection bring to the Learning Journey
This is great because self-reporting is repeatedly shown to be a powerful tool for inspiring learning: it increases self-awareness and ownership, and can help bridge the gap between home and school life.
The day to day collection of this is a challenge in and of itself however, because it’s another set of data collection points for schools to manage.
With the number of education systems and digital tools increasing, schools need to create universal approaches to all their data collection processes.
They need to think strategically about: what are we collecting? Is it consistent across every member of staff? What’s the cadence of collection? Why are we collecting it?
“If your performance data is in a separate spot from your attendance data, which is sitting apart again from your welfare data and student surveys, you’re going to miss out on a lot of insight.’’
Connecting those data sources can feel like a big problem. But modern tools exist to tie all of those disparate data points together, and it’s easier than you might think.
Schools often think they ‘don’t have enough data’ to start, or their ‘data is not good enough’. But even a simple data consolidation project – between two or more sources – can bring massive value: suddenly turning scattered and unavailable data into focused, highly accessible data.
This then allows schools to access a single narrative about an individual student and empower stakeholders to affect instruction and pastoral care in more meaningful and holistic ways.
The bigger picture
The data that we get from an individual day of a student self-reporting isn’t necessarily meaningful in and of itself. Nowhere near as much as it is when we start to look at that longitudinally.
Once we’ve collected this data over a period of time, we can start to look at trends. Are people becoming happier, less happy, more content, less content, more restful, less restful, over time?
One of the things that we most commonly provide to schools is a student profile that brings together empirical data like attendance and basic performance. Longitudinal welfare data is a really valuable additional lens to add to that profile because it allows you to look at trends in performance or attendance in the context of self reported subjective data about that welfare experience.
This helps school leaders and educators understand how students are developing and focus on certain intangible, esoteric skills (like determination, resilience, confidence and grit) beyond the usual performance and examination reports.
Data projects are not ‘one-size-fits-all’
Wellbeing is a multidimensional construct. It interplays very differently between cultures, and for children compared to young people and adults, for example.
There are hundreds of models that offer different ways of thinking about student welfare and wellbeing. I particularly like this recent one that defines it as a balance between resources and challenges:
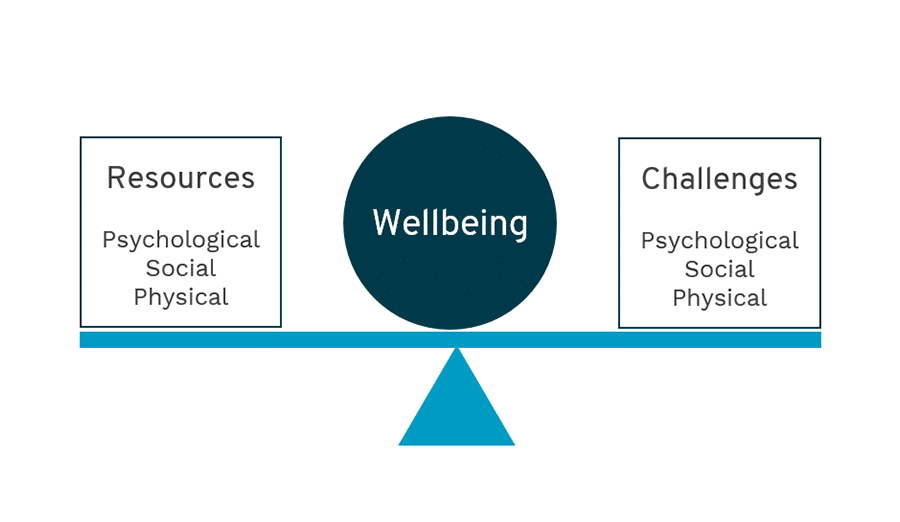
Source: Dodge et al. 2012: The challenge of defining wellbeing
Schools, together with education technologists need to determine the appropriate scope and emphasis in the way they define ‘wellbeing’, relevant to their context and purpose.
No two schools are the same. Each has its own personality; a slightly different way of implementing its Student Management System and Learning Management System; and idiosyncrasies around how they collect data.
It’s important that edtech tools account for this in their design so that the insights they present are as relevant and constructive as they can be.
As one example, Octopus BI’s Tentacle (which visualises school data directly in Canvas LMS) offers a settings section where a school admin can adjust weightings and decide which outcomes to include.
This empowers schools to understand for themselves how risk and engagement is calculated so they can tweak that to suit their individual context.
Visualize this: wellbeing is modelled like NAPLAN
The jury is still out on how we’re going to measure and bridge the ‘COVID gap’, in both learning loss, and student social and emotional development, but I think it’s obvious – data has a key role to play.
Interestingly, 71% of teachers surveyed last year believed aspects of online learning can improve educational delivery industry insights.
With the amount of data schools’ collect increasing, educational leaders have a huge opportunity to harness actionable insights to improve student welfare and learning outcomes, now and in the future.
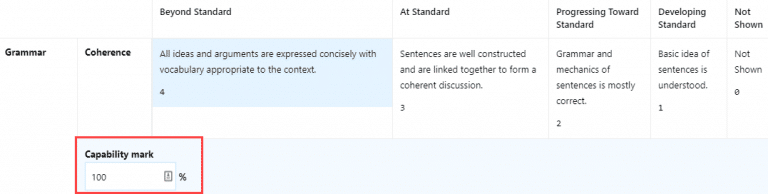
We spend a lot of time modelling the results of formative assessment results like NAPLAN, PAT and HSC. Imagine if the same effort was applied to analysing student wellbeing?
I firmly believe that change will come from individual education institutions in this area.
2020 showed how fast we can reinvent education. Perhaps 2021 will show how important student voices are in the reinvention to come.