School’s are collecting more and more student data via an increasing number of education technology platforms and systems.
The problem is, these systems aren’t integrated.
Online learning management systems (LMS) and student information systems (SIS) in particular capture and store a large amount of data, but they don’t have the capability to aggregate and integrate that data together to provide holistic, actionable insights on the student learning journey.
Having technology solutions that collect and analyse information isn’t a useful investment if school stakeholders feel the result is impenetrable or inaccessible.
Technology solutions need to be real solutions for every user, not only power users.
That is why Octopus BI works directly with schools to integrate over 100+ education systems – from SIS like Synergetic and Edumate, LMS like Schoolbox and Canvas, and even operations and financial management systems – and ensure that the resulting learning analytics dashboards surface all the necessary information in accessible, understandable visualisations.
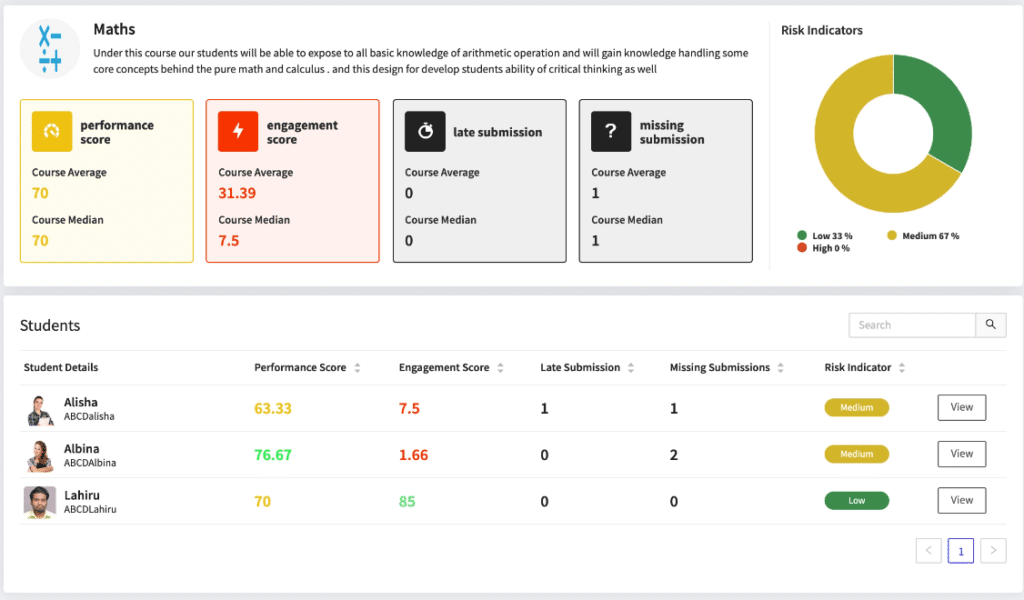
Class Dashboard showing risk, performance and engagement insights:
This Dashboard shows aggregated risk, performance and engagement scores, plus late and missing submissions from Canvas LMS, for the Maths class and individual students in that class.
Tools like OctopusBI help with the critical task of analysis of schools’ data, transforming data from numbers in storage into powerful visualisations that can inform confident decision-making and planning for future student and school success.
How to use education analytics integrations
The insights that are available in data are relevant and constructive, if only school community stakeholders can access and understand them. That’s where education analytics tools that integrate smoothly with LMS and SIS come in.
The SIS manages information about schools and students; its name reflects its purpose, and it might be referred to as either a Student or School Information System (SIS), or a Student or School Management System (SMS). A Learning Management System (LMS) manages course resources, as well as learning in and out of the classroom.
There is often overlap between the data these systems collect, and it is beneficial for an institution to integrate them to make them more efficient.
With a good analytics tool integrated into schools’ LMS and SIS, uniting data sources, data can be used to answer many different questions at different levels.
Where are schools succeeding nationally, or state-wide, or in a particular region?
Which areas require improvement in this particular school or year group?
Which individual student needs help with which topic, and how does that student learn best?
School community stakeholders such as teachers and administrators can use education analytics tools to cross-reference longitudinal trends in academic achievement with, for example, welfare data.
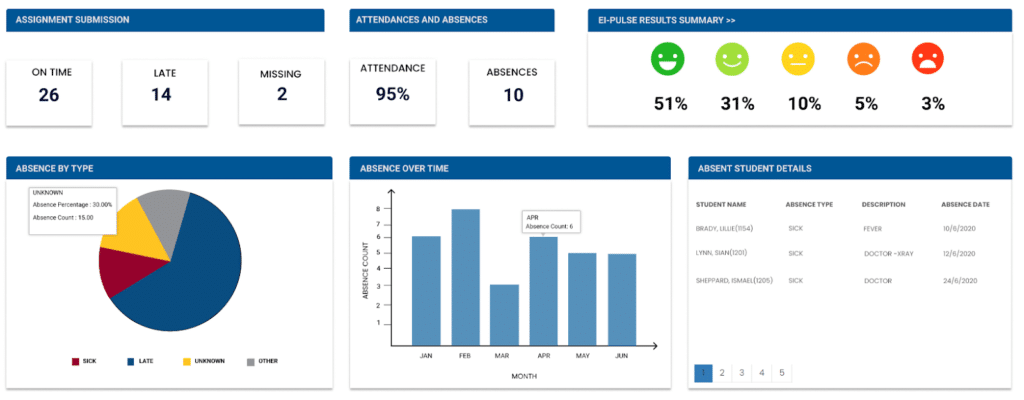
A Secondary Class View aggregates student attendance data next to EI Pulse (wellbeing and engagement) survey data
Head Teachers and other school leaders can better understand and predict retention, growth and potential of students by measuring learning trends in classes, subjects and cohorts.
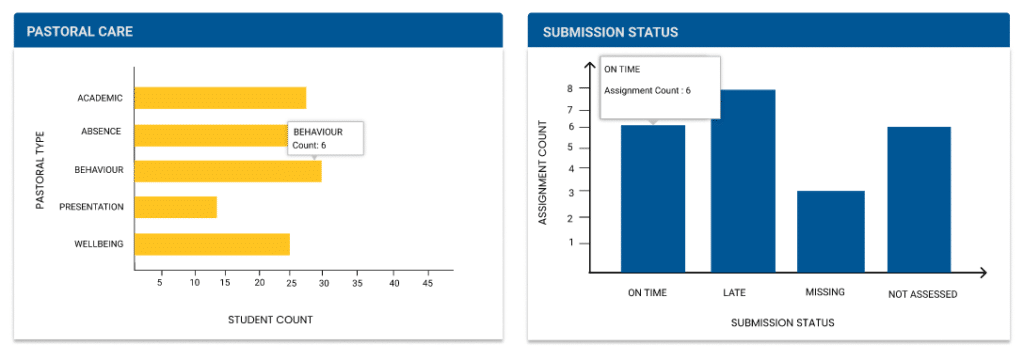
Dashboard showing behavioural and pastoral care insights next to assignment submission summary
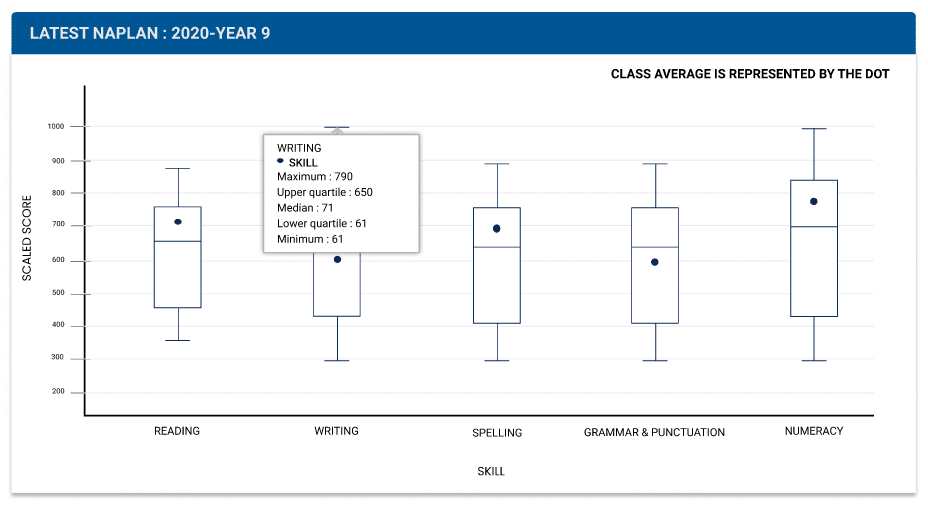
Dashboard showing average NAPLAN results for a particular class
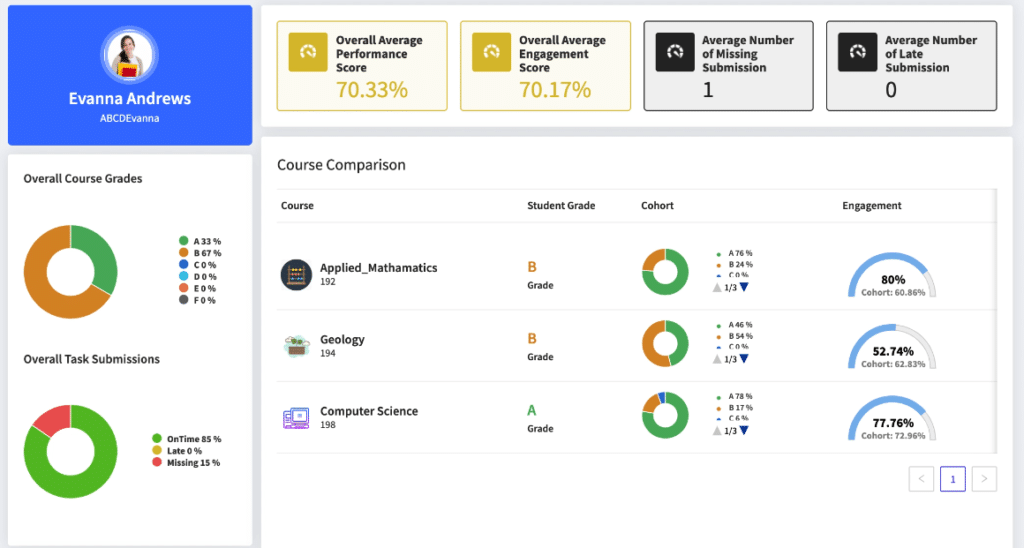
Education analytics tools can also give a quick current (often real-time) snapshot of a student’s grades and engagement, eliminating the need to wait for annual or half-yearly reports, and integrating more data than periodic reports can.
This learner profile view gives a summary of the courses the student is doing in Canvas and her grades and tasks submissions that are on time missing or late, plus her engagement level against the cohort
All this provides the foundation for improved parent-teacher communication, teaching and learning strategies and evidence-based decision making in schools.
The integration of analytics into education systems is the next necessary step to make data about a student’s learning journey truly useful.
Education analytics integrations help individual schools and students
Every school has a slightly different way of implementing its technology platforms, choosing different LMS and SIS, and additional tools that may complement and feed into these. They also may have slightly different priorities in which data they collect and care about, and how they collect it.
As every school (and every student) is different, schools cannot solely rely on other schools’ data modelling, or national data modelling, to know about individual students, staff or school circumstances. Other schools may use different tools, or exist in a different set of circumstances. National averages cannot take into account individual circumstances. From one class to the next, students can be very different, let alone between different schools.
With the implementation of analytics tools at a particular school, teachers, parents and leaders can learn more about their particular students and their circumstances. This means that education analytics tools are not only useful on the big scale, but on the individual scale, too.
For example: how often a student uses an educational mobile app, their last three years of formative assessment results, and their self-reported well being information may sit in three different tools.
By integrating these tools and overlaying them with an analytics tool like Octopus BI, unprocessed segregated data becomes a series of informative visualisations in custom dashboards accessible not only to that student’s teacher, but also school officials, their parents and even the student themselves – with the most current information available, ready to help when the help is needed most.
WATCH: how Tentacle quickly provides teachers with a view of the whole student by aggregating Canvas LMS data with SIS and other data:
Teachers already have an instinctive understanding of their students arising from their interactions with them. The integration of analytics with a school’s LMS and SIS can then serve as a powerful assistive tool to augment this understanding and provide data-backed evidence for teachers to make more confident decisions about their students on an individual basis, as well as on a greater scale.
Analytics software makes LMS and SIS work harder
There are numerous technological tools that schools can use to improve their operation, their strategic planning, and their students’ learning outcomes. But these tools are often disparate, relying on schools and teachers to do all the legwork in using them efficiently.
When these tools are integrated, not only is their core functionality often improved by other complementary tools, but it becomes possible to draw together disparate data and generate holistic insights about schools and students.
Schools need to link up their available data sources, and then process that data in ways that can help them answer their questions. Clear visualisations of data can help administrators and teachers start discussions, find patterns and trends, and make decisions for the future for their schools and students.
Octopus BI believes in the value of understanding all aspects of a student’s performance, behaviour, wellbeing, skills growth and potential, and helping that student move toward success in all key areas.
In much the same way, there is immense value in integrating all aspects of a school’s data collection, and helping that school understand and use its data to best shape its unique path to success.
Comments are closed.
A New Chapter with Qoria: Expanding Our Commitment to Student Safety and Educational Impact