
In today’s information age, education providers have a unique opportunity to take advantage of all the technological advances available to them. This includes the proliferation of tools that allow for the collection, reporting and analysis of student data, a field also known as education analytics, or learning analytics.
In the online, hybrid, and physical classrooms of today, there are tools that can track student success, student engagement and understanding during and after the delivery of lessons. Moreover, student profiles and dashboards can also incorporate critical information, from demographics to wellbeing to learning strategies that work best for student outcomes. Data can be gathered and analyzed in real time across a period of days, months, or even years.
Armed with this data and the insights gained from it, teachers can then make data-informed decisions to help improve learning, guide planning and instruction, and make any interventions that may be necessary, whether for students, classrooms, year groups, or even themselves. This works in school-age and higher education, and even vocational and workplace training settings.
Undoubtedly the crowded market of tools has resulted in some teachers being inundated with information, notifications, and requirements, and unfortunately, in most cases they are offered little training to help manage this overload. In this article, we’ll share practical tips to help teachers get the most from data, and make more data-driven decisions with confidence.
Tip #1: Find the insights in the data
To get started on making better data-informed decisions, you need to have confidence in what the data is telling you. You don’t need to become a professional data analyst to do this!
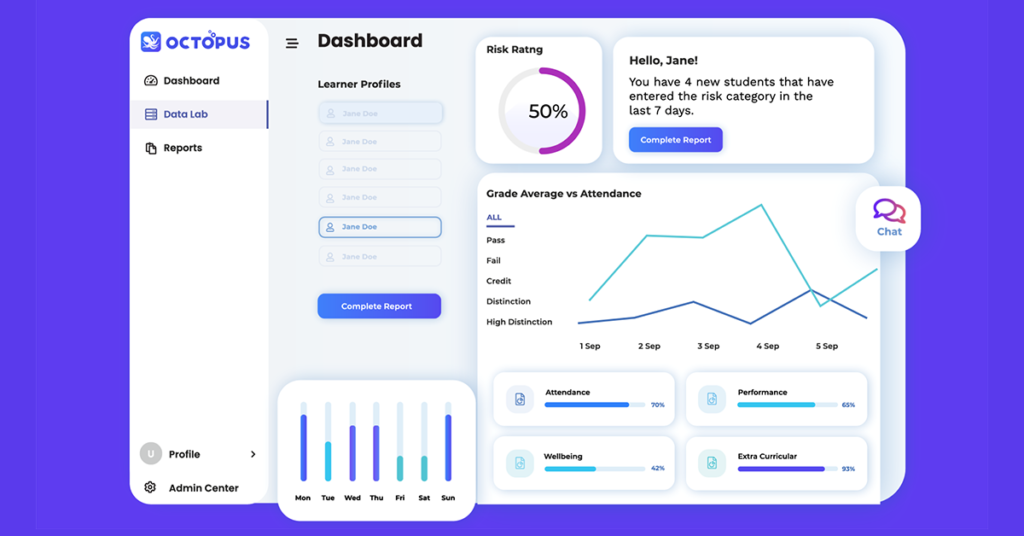
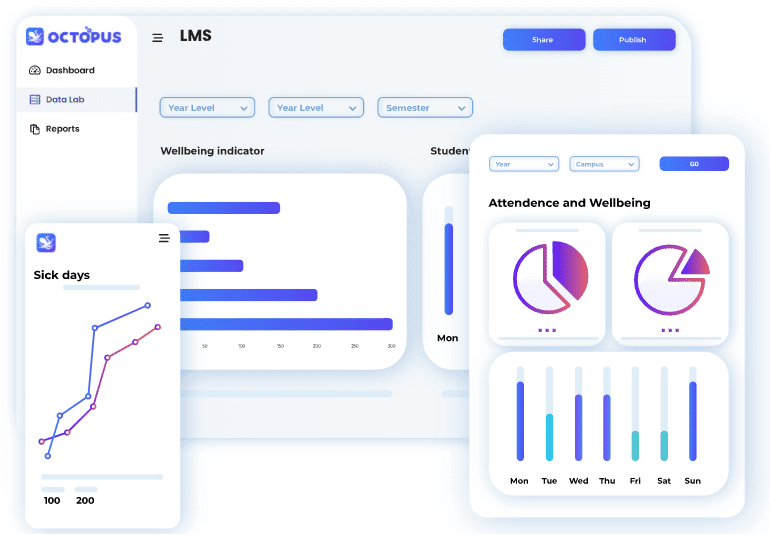
There are six basic steps to turning data into actionable knowledge. Collect data, organize data, summarize data, analyze data, synthesize data into information, and finally, make decisions based on that information. A third party data partner can help unite your data sources and use machine learning to turn hard-to-access, siloed data into business intelligence, visualizations, dashboards and profiles of students, classes and course groups that every instructor can see and use.
Once you have these data tools, they’re visible and accessible to everyone who needs them, and integrated with things like learning management systems and student information systems, you’re already better-equipped to make more confident decisions. With evidence based insights, you can build a data-driven culture at your institution. Here’s how to start:
Tip #2: Use descriptive learning analytics to understand a student’s past and present

There are three key ways you can use educational data: to describe the past and present state of things, to diagnose the root causes of things, and to predict future patterns. These are all branches of what we call “learning analytics” or education analytics.
Educators and administrators can easily use descriptive data for decision-making. Past student data indicates what skills students have, and where they’ve struggled; it can reveal whether they have advanced, as-expected, or below-expected understanding of topics. Advanced students can then be offered alternate activities to maintain their interest, engagement and success. By keeping an eye on patterns and forecasts, students who require support can be identified and more quickly offered assistance.
Tip #3: Use diagnostic learning analytics to understand the whys of success and struggle
The second kind of learning analytics is “diagnostic” analytics. This simply means using data and information to understand why and how something has occurred. When your learning analytics system flags a student as declining academically, other sources of data may hold the answers as to why, such as a pattern of non-attendance, a mental health stressor, or a pattern of failing to understand a certain topic (e.g. scores declining because the student missed a class on key principles that informed the rest of the semester’s work).
Using both existing data and a little intuition, educators can then identify what support may be needed, such as tutoring, moving to a different location in the classroom, or emotional or mental health support. Furthermore, instructors can tailor their curriculum and teaching strategies to plan out their roadmap for teaching using this type of analysis. They are better able to identify which areas might need more focus across the entire class or course group, and which will be easily grasped.
Tip #4: Use predictive and prescriptive learning analytics to envision the future

The third field of learning analytics is in predictive and prescriptive analytics. This is when your data tools are able to use existing data to forecast patterns of success or risk in a student or class’ future, and allow educators to intervene accordingly.
Once you have access to powerful data visualizations, it’s all a matter of checking in regularly so you start getting a sense of what certain graphs and metrics may mean. For example: you notice quiz scores are higher on Mondays, and lower on Fridays. From this insight, you may either decide only to hold quizzes on Mondays, or else investigate what else may be drawing students’ energy on Fridays, like a quiz in another class that takes up students’ study time.
Another example is in setting curriculum and grading. By assessing past performance in certain courses, predictive analytics can help educators assess a curriculum’s strengths and weaknesses, identify which teaching and learning strategies worked best, and help set appropriate standards and expectations for grading assessments.
Tip #5: Use both quantitative and qualitative data

Data-driven decision making and teaching are excellent areas to invest time and learning into. That being said, there is no replacement for human intuition and experience in the classroom. Both are vital ingredients in the future of education systems – meaning an educator should be able to combine both their personal and technological skills to benefit students.
In the same vein, both quantitative (data, statistics, numbers) and qualitative (non-numerical, words, observations) data are critical components of a holistic approach to data strategy. By incorporating a variety of information sources into student dashboards and profiles, teachers can get a much rounder understanding of students, from their achievements and attendance, to their mental health and wellbeing and self-reported class and course sentiments, to their demographics, home situation, and both short- and long-term goals.
Students are more than their test scores. By having all this information at their fingertips, educators can make much more confident and well-informed education and business decisions, ensuring students achieve their educational goals, and schools build more positive learning outcomes.