
Future-thinking schools often want to take advantage of the benefits of technologies like artificial intelligence and machine learning for their staff and students. This is a fantastic initiative, and definitely a long term goal for all education providers, as there are many benefits technology can offer.
However, schools must walk before they can run. What this means is that education institutions must learn to collect, connect and take advantage of their existing data before they can advance their education data strategy and start to move towards more sophisticated solutions like bespoke school dashboards and learner profiles.
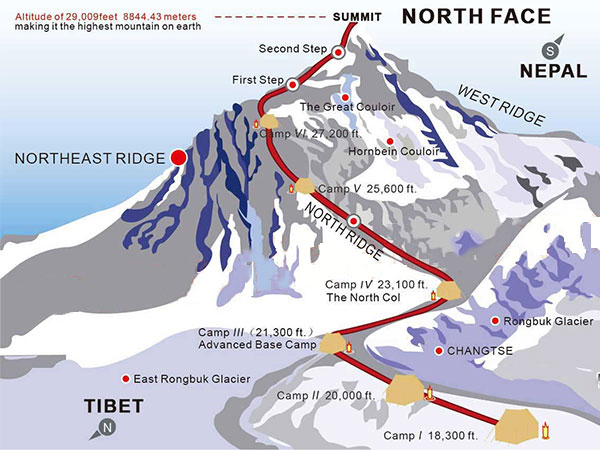
This journey can resemble the massive endeavor that is climbing Mt. Everest. Before you can strike out for the summit, there are seven key things that will help you have a much more successful journey:
- a good base camp
- your toolkit
- experienced guides and fellow climbers
- maps
- communication and timing
- your instincts, feelings and motivations
- and finally, your ability to combine all of these and know what you really need or want to face the challenge in front of you.
These key things actually translate well into a school’s journey towards sophisticated data strategies and school dashboards.
Step 1: Establish Base Camp – a data foundation for student dashboards

If you want to climb Mt. Everest, you need to camp along the way. Every climber starts at Base Camp. Another way of putting this is don’t put your cart before the horse.
If you want to work with advanced data modeling, you need to get control of the data you already have access to. Whether your data is dirty, messy, or spread among several separated silos, you need to pull it together and clean it up as much as possible, and give yourself a good starting point.
“Any data business, including educational institutions, can only report on data that actually exists.”
Data connectivity and consolidation is a critical first step to a longer journey. You can’t get to the long-term without first spending time on the short-term. If the data doesn’t currently exist, you have to start collecting it. If it exists but you don’t know where, you have to locate it, consolidate it, visualize it, and learn to interpret it.
Step 2: Asses Your Toolkit – School and learner dashboards are built using good tools
From water and oxygen tanks, to protective gear and transport, to pitons and rope, there is a wide array of tools that can help make a difficult climb easier. But first you have to know your tools well enough to know if they will help you reach the peak.
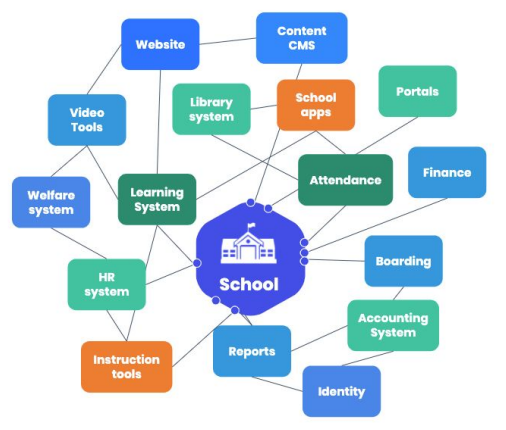
Schools may already have implemented tools to gather, manage and visualize data relating to students, staff and operations, for example LMS and SIS tools, surveying tools, or analysis solutions. You need to assess existing solutions, find out if they’re talking to each other, and whether they’re giving you what you actually need.
Once you’ve identified gaps, you can start to fill those gaps and create more sophisticated data models and visualizations, and look to engage in deeper reporting and measurement and analysis of the whole student or class.
Step 3: Hire Experienced Guides – to guide your school dashboard project
From sherpas to fellow climbers, this step is all about partners who will either help you make the tough climb, or provide advice and wisdom to guide your steps. Often this wisdom comes from your climbing partners’ own vast experience in the area.

Technology partners have realms of experience in setting up both basic and advanced, customized data solutions for education institutions. Partnering with one lets them do what they do best, while you do what you do best. This step also involves building experience and growing a culture of data literacy at your school – equipping stakeholders with the knowledge of how to use data and technology tools to achieve the results you need.
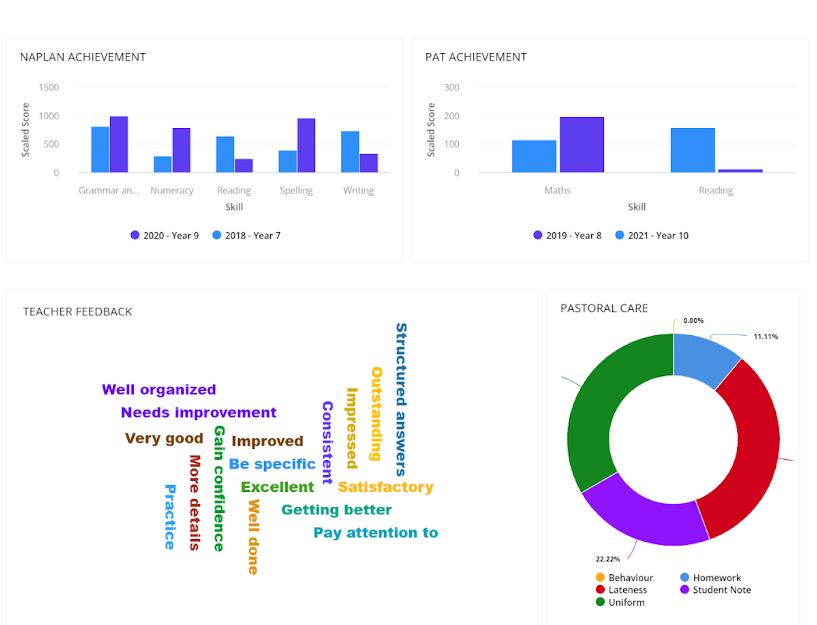
Step 4: Use Maps – templates to inspire your school dashboard views and learner profiles
Heading out into uncharted territory can be terrifying. If you have maps, you will find yourself much more confident! Climbing Mt. Everest, you may find fixed lines, for example, that others have staked out for you to follow. In time, you might even discover new paths to add to existing maps.
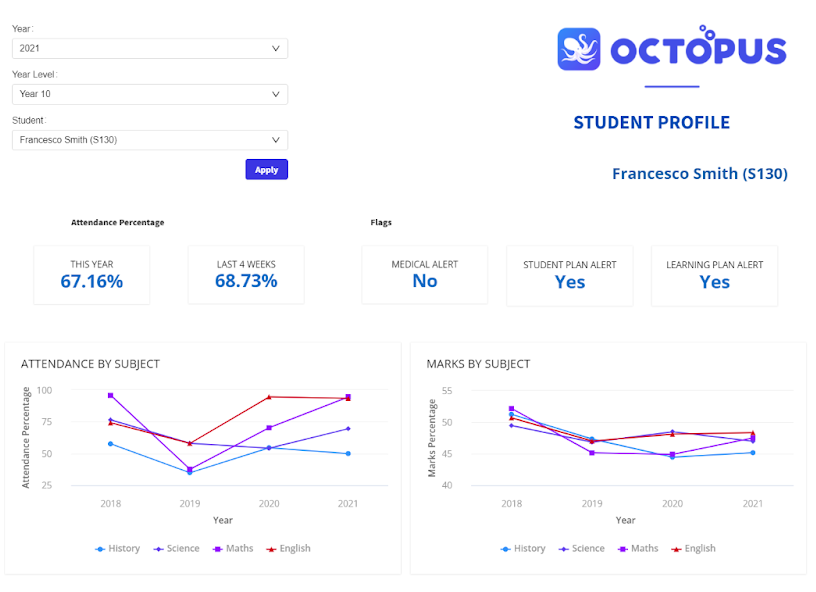
When you’re beginning to work with your school’s data, you don’t have to start with a blank page. Here is a sample of visualization templates many schools start out with before moving onto more complex, custom solutions:
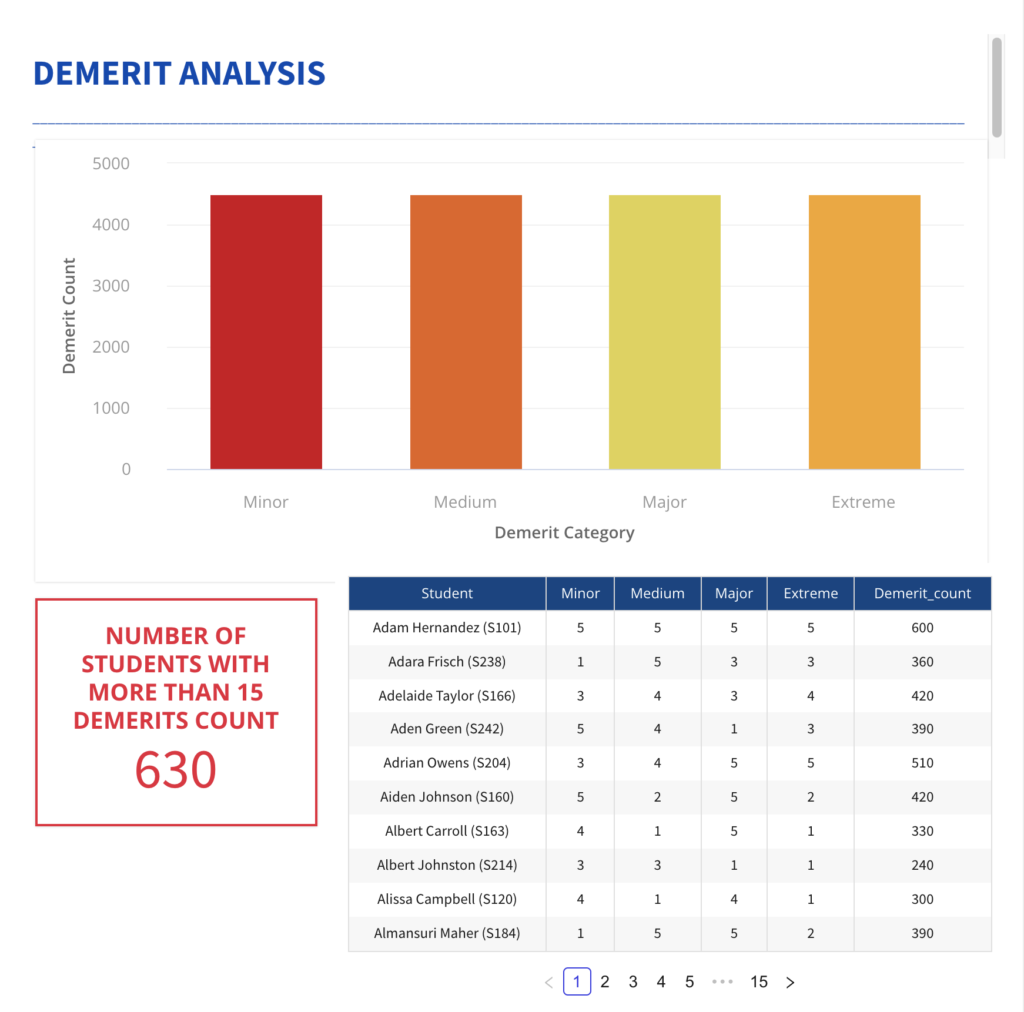
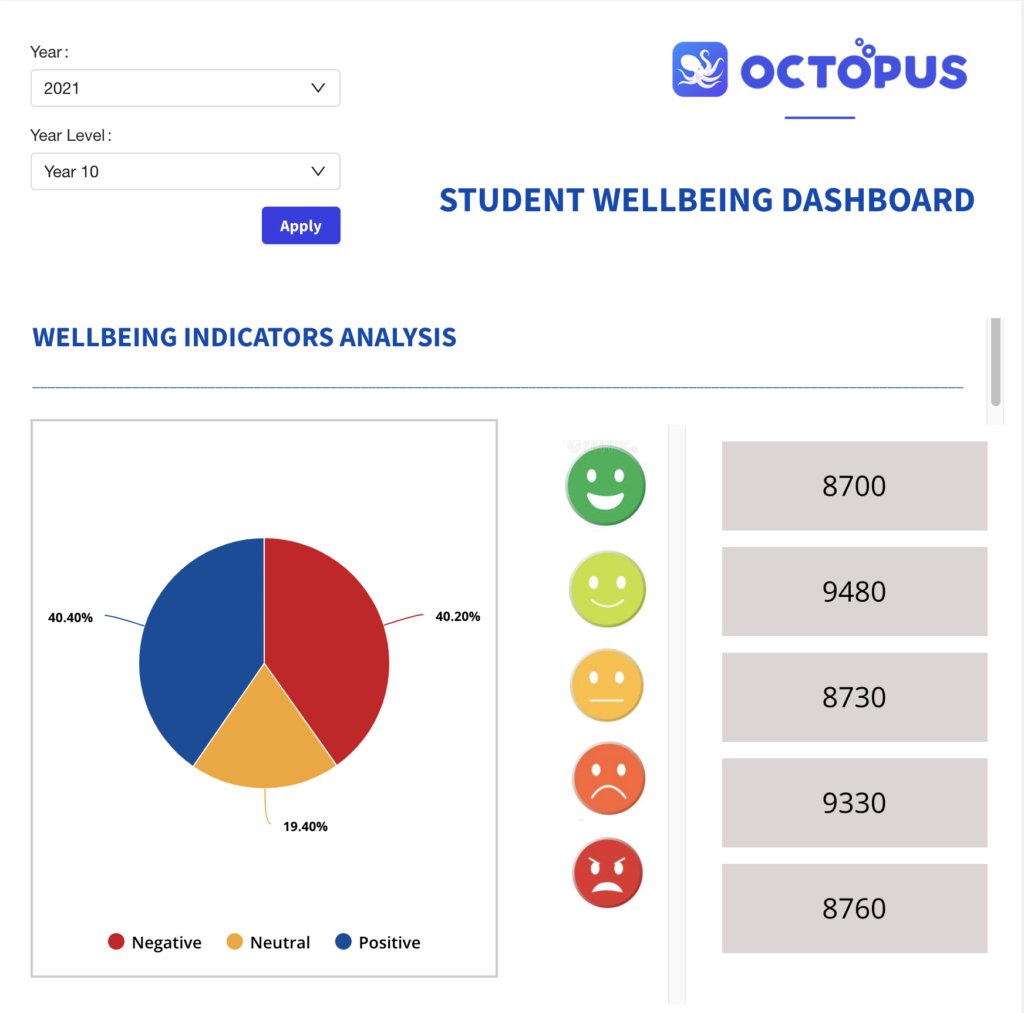
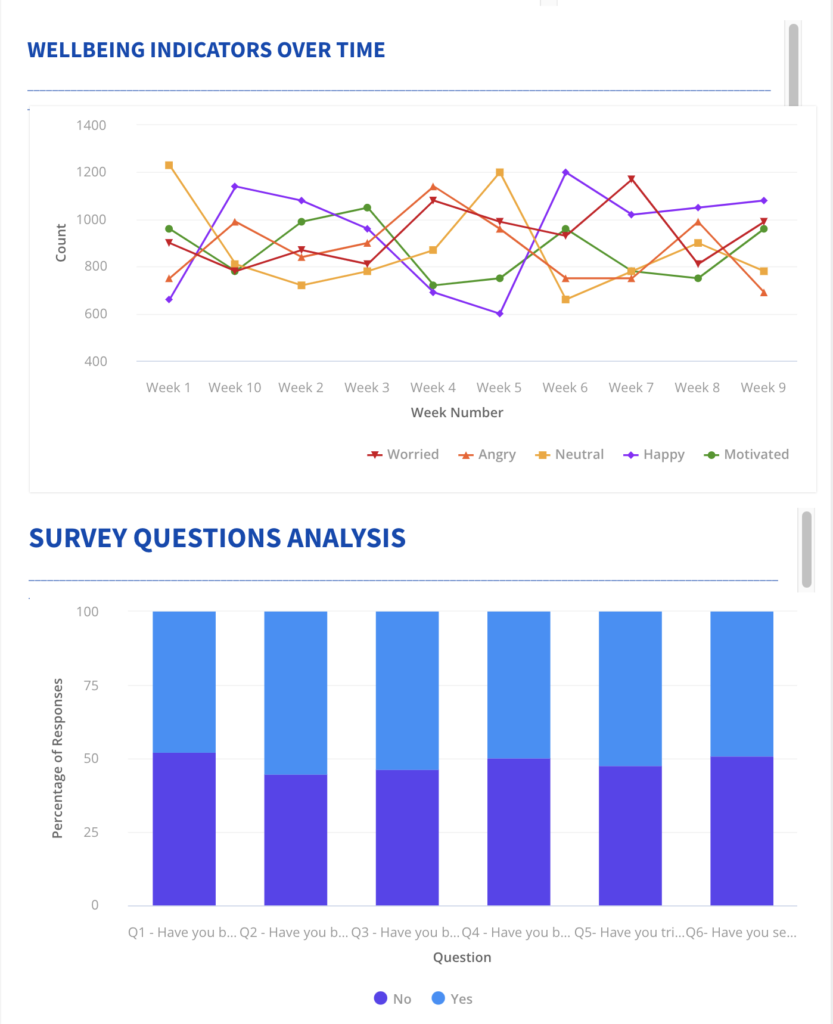
- Student profile and Class profile
- External test analysis
- Year coordinator view, Executive and Principal view, Parent view
- Wellbeing
- Financial
Step 5: Communicate – get your timing and approach to school stakeholders right
Whether you’re climbing alone or as a team, communication with others is critical to climbing! You’ll need to talk about your plans, weather conditions, route obstacles and more. Once you set out from base camp, conditions and plans can change at any time, requiring more communication.
Students, teachers, parents, school boards, the government and education department – these stakeholders may all need to contribute or receive output from your data dashboards. The timing of these contributions and updates can be as critical as the information, especially when it comes to risk management and early intervention.
Learning the best times and the best ways to communicate with stakeholders is an important part of your data journey. It also helps to build confidence in the school’s capability to report in true, meaningful, real ways.
Step 6: Check Your Feelings, Instincts, Motivations – incorporate subjective data into school dashboards

Himalayan peaks require months of endurance training before you’re ready for the real thing. But endurance is not easily measured. You can build it, train for it, and you must have in order to succeed, but outside of lung capacity and calf strength, you can’t quantify it. To climb Everest, you have to have the right attitude, as well as good instincts to know when to press forward and when to turn back.
Schools today want to measure whether a student is a thinker or a reflective learner, whether they’re resilient, or creative, or problem-solvers, or a host of other key 21st-century skills. This is subjective data that you can measure and use to benefit students, employing observational data, self-reported data, and complex modeling. You can even integrate it with empirical data to form holistic pictures of students or classes across the realms of wellbeing, performance and engagement.
Step 7: Combine All Your Learnings – school dashboards need all of the above and more
This brings us to the climb itself, and hopefully reaching the peak. Even inexperienced climbers have summited Mt. Everest. They all start from base camp, with great guides, and they all have the right gear, research, maps, communication skills, timing, and attitudes.
When it comes to your school’s data goals and strategy, you may not need or want to invest in complex projects right away. But once you connect your existing data sources, like your Student Information Systems and Learning Management Systems, you can start to use templates to work towards visualizing your data in new ways, and communicate your learnings to key stakeholders who can then take action.
There are often immediate benefits to investing in your school’s data strategy, like identifying and helping students or teachers in need of support. But there are also long-term benefits like creating improved student experiences, increasing engagement, and achieving positive outcomes across wellbeing, performance, and 21st century learning – goals that every school shares.
Data is an invaluable part of an education institution’s journey now. It can help inform your actions and plans, build your confidence, and set and reach your goals. So set up a base camp, get a map, hire a guide and start climbing!