Gartner defines data-literacy as the ability to understand, share common knowledge of and have meaningful conversations about data, especially to drive better business outcomes.
In the world of education, the prime goal of data literacy is to enable educators to continuously improve teaching and learning in the classroom and across the school.
If we want to enable teachers to be agents of change at the classroom level then we need to rethink the ways in which we present data to them.
One thing I learned very rapidly working in the education technology sector is that there’s a broad spectrum of data literacy and propensity for data use across the industry, and even within single organisations.
A Head of Teaching and Learning in an institution will likely have a strong appetite around data models and ways of leveraging things like z scores or student growth. However, that’s vastly different from how an individual teacher would want data to inform the micro changes they make when they’re interacting with students at the classroom level.
If we want to empower teachers and school stakeholders to act on timely insights, the edtech vendor landscape needs to provide flexibility. I talked about this on a panel at EduTech last month:
To explore this further, I’d like to walk through three considerations for schools who want to deliver student and school dashboards and realise the benefits of education analytics.
I call this the A B C of edtech adoption:
A - Alignment - to lift student experience and enable integration
With software now easier and faster to deploy, schools are acquiring additional layers of instructional design tools and other point solution tools at a rate not seen before. At the same time, they continue to invest in core tools, like Student information and Learning management systems.
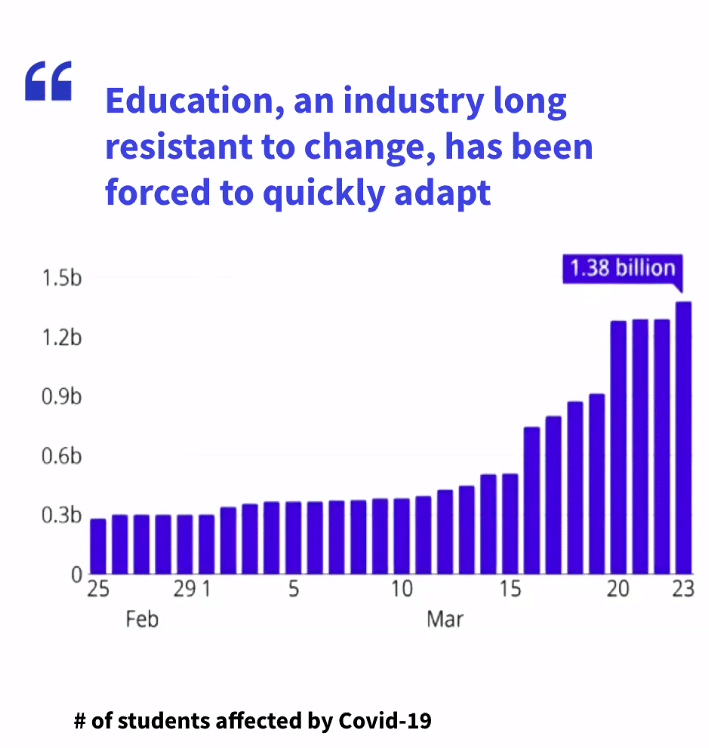
COVID-19 saw online tools get adopted even further. Content had to go online. Assignment submission had to go online. Feedback had to occur online. It had to happen, and so the sector adapted quickly.
While it’s overall a great news story that ‘schools have gone online’ – online means something very different from school to school, and from primary schools to secondary schools across the entire breadth of the blended learning spectrum.
Studies show almost 60% of teachers, whilst they were directed to move their content online, were at liberty to use whatever online tools they wanted.
With a burgeoning number of different edtech tools in use, it’s increasingly difficult and time consuming for educators and leaders to get an accurate picture of stakeholders inside the institution, through the data they collect.

The fact is, there is a tension between the opportunity for data collection when business processes are universal; and the fragmentation that occurs when there is complete freedom of choice at the classroom level for the way things are done. This is a difficult area for school leaders to navigate as they strive to support teachers in a stressful time. However, the opportunity for data collection and visualization for student growth and risk interpretation can become problematic when it is not addressed.
That’s why the first step in adopting education technology (and building data literacy) needs to be alignment. Alignment across institutions on what tools should be used for what.
Aligning on new processes will likely require strong leadership to gain consensus, but the reward is longer term benefits for both students and institutions.
If students have defined common places to go for all of their learning, or for all of their video interaction, that’s a more seamless and engaging learning journey. By doing that schools will also be in a position to get a much clearer picture and more higher quality data.
Now is a great time for schools to be thinking long-term about creating a ubiquitous school-wide approach to online learning and their process for diagnosing risk and early intervention needs.
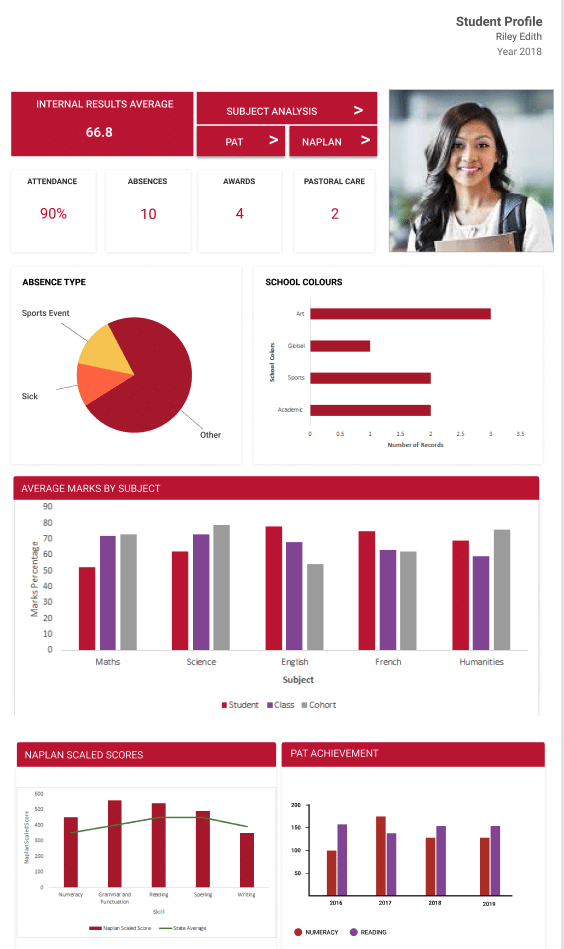
When edtech tools are integrated, not only is their core functionality often improved by other complementary tools, but it becomes possible to draw together disparate data, the most common example being the LMS and SIS, and generate holistic insights about cohorts, classrooms and individual students, for example through a learner profile.
By linking up the data sources behind commonly used technology platforms, schools can process that data in ways that can help them answer their questions, find patterns and trends, and make better decisions for the future.
B - Behaviour influence is key to adoption
When I talk to schools about their data projects, the biggest fear is that the project won’t be adopted successfully.
Education institutions have consistently been challenged by school wide adoption of complex projects and tools. COVID-19 has provided another reason for organisations and teachers to potentially be feeling change-fatigued, training-fatigued and decision-averse.
To reach teachers, we truly need to understand their pain points and realise that even the most innovative technology can’t compete with 55-60 hour work weeks.
We need to make the change as close to gravity fed as possible, to help schools manage adoption risk.
That means looking for existing business processes or practices or strategies or directions that schools are leading that can integrate with, or support, the new project.
If a school can choose easy-to-use tools that are connected with processes and platforms they’re already working with, then that change becomes fed by need and an existing set of behaviours.
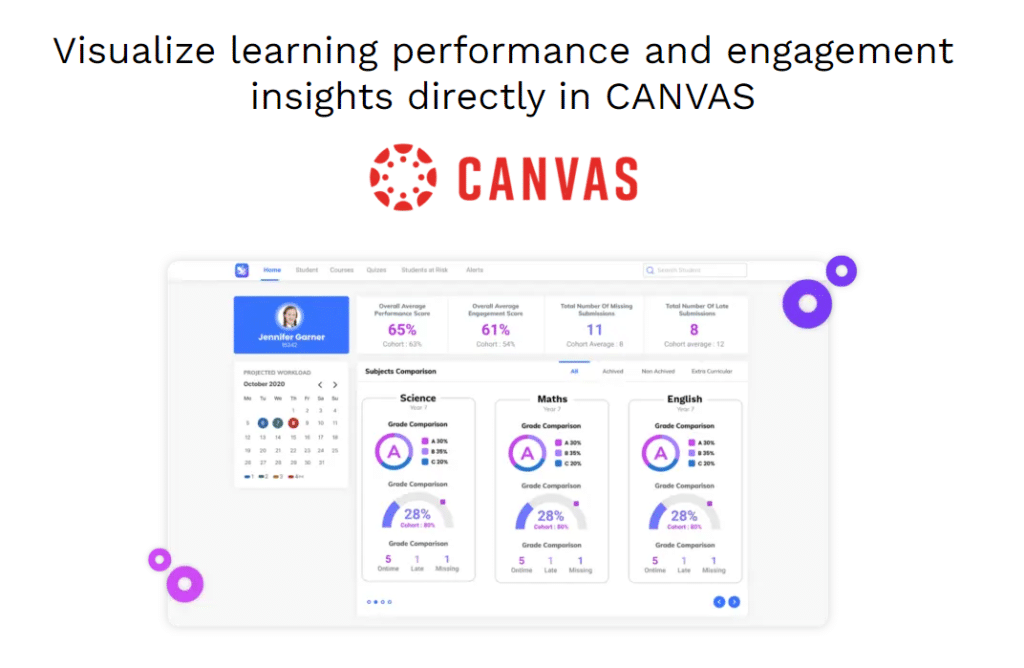
A great example of that from Octopus’ perspective is the ability for us to create interaction between dashboards and the data within existing student information systems or learning management systems, like Synergetic, Edumate, Schoolbox or Canvas.
Increasingly sophisticated tools allow us to run live and secure queries through API’s to surface a wealth of data in new and useful ways.
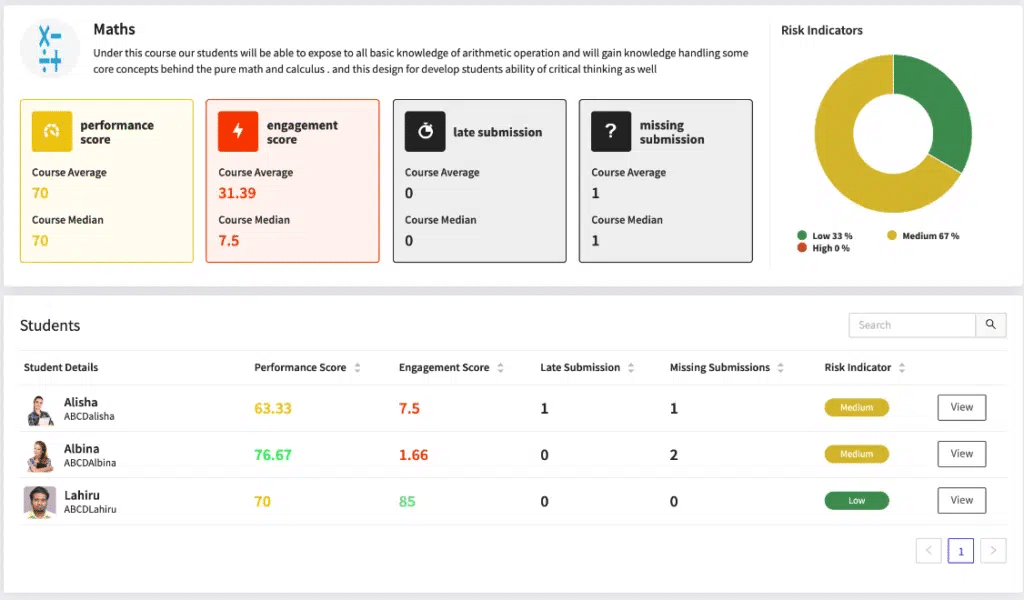
For example, a teacher might want to look at how an individual student is performing and their level of engagement, and then quickly compare that across the class or cohort.
By empowering a school administrator and teacher to log into Canvas LMS and see dashboards directly in their existing workflow, they start to see the value of a) using the defined LMS as a central repository for data and b) the value of access to dashboard visualizations.
By thinking carefully about how and where we present insights from data, we start to solve some of the common problems data projects experience around last mile analytics and impact.
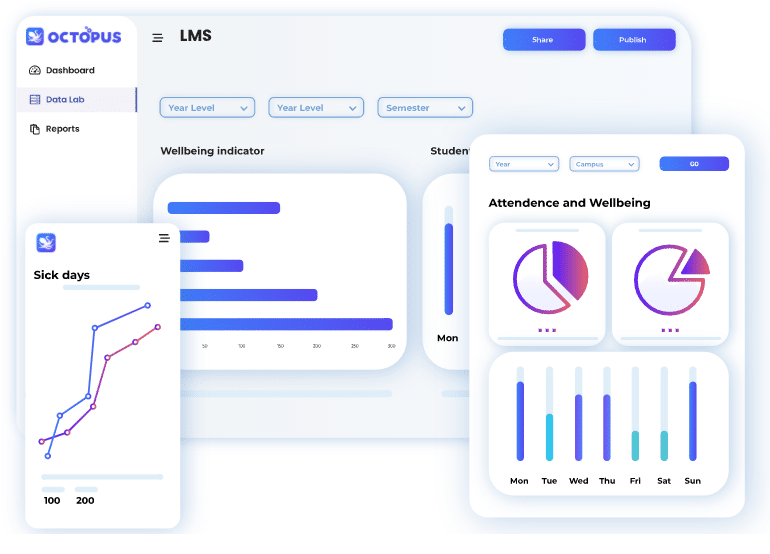
‘Lite’ edtech tools are gaining in popularity because they reduce time to adoption for schools and serve up immediate value. That’s what Tentacle for example was designed for: allowing institutions using Canvas to do an instant self trial of a sophisticated education analytics technology platform.
Creating such frictionless, secure, experiences is a great way to engage the education industry in the value of data analytics projects.
Schools using lite platforms often will move to premium and keep lite versions an information source for teachers. To me, that proves there’s an immediate need that can be satisfied, and there’s justification around investing in that immediate need.
C - Change - starts with one thing
Creating such frictionless, secure, experiences is a great way to engage the education industry in the value of data analytics projects.
Most schools I speak to worry that A) they don’t have enough data and B) their data’s ”not good enough” to convert into valuable insights. But one simple data consolidation project can bring massive value: suddenly turning scattered and unavailable data into focused, highly accessible data.
For those institutions that don’t have the time or capacity to even think about their long term data strategy, lite value-oriented tools allow them to start with what they have and simplify the addition of data into the map.
Satisfying an immediate need for insights builds organisational maturity and sets in motion an increase in conversations about data across faculties, departments and, ultimately, the whole institution.
Long term, this creates an environment where there’s a better framework that enables more profound data conversations, even when new data collection processes are part of what is required to get quality results.
In order to be able to invest the time, energy, expense and resources needed to adopt sophisticated large-scale technology solutions, schools have to grow the data literacy and data maturity inside of their own organisation.
As edtech providers, we have a key role to play in lifting the digital maturity and data literacy of the entire sector.
By creating solutions that understand teachers’ pain points and speak their language, we can help schools build the capacity for data-informed practice.
Alignment of school processes around a vision for data-driven teaching and learning is the first step – and it’s a shift in mindset as well as systems. Incremental changes in Behaviour will turn the wheels towards wider scale understanding, creating new conversations and a foundation for Change.
Change happens when the pain of staying the same becomes greater than the pain of changing. By harnessing what’s already compelling educators, we can smooth the adoption path towards future learning experiences, where technology does more of the heavy lifting, enhancing human interactions and individual student individual potential.