
Vocational education and training (VET) is a critical arm of any nation’s education infrastructure, including Australia’s. This article explores how the VET system can benefit from advances in education technology and business intelligence, including data analytics and visualizations.
In Australia, 3.9 million students were enrolled in VET programs and subjects in 2020, including over 300,000 apprentices and trainees and 240,000 VET students in schools.
In 2021, 56.6% of employers provided at least one form of accredited training, while 52.2% provided unaccredited training. Only 11.2% of employers provided no training at all. This demonstrates the overwhelming positive value that employers and employees find in encouraging continual learning, training, upskilling and employee development.
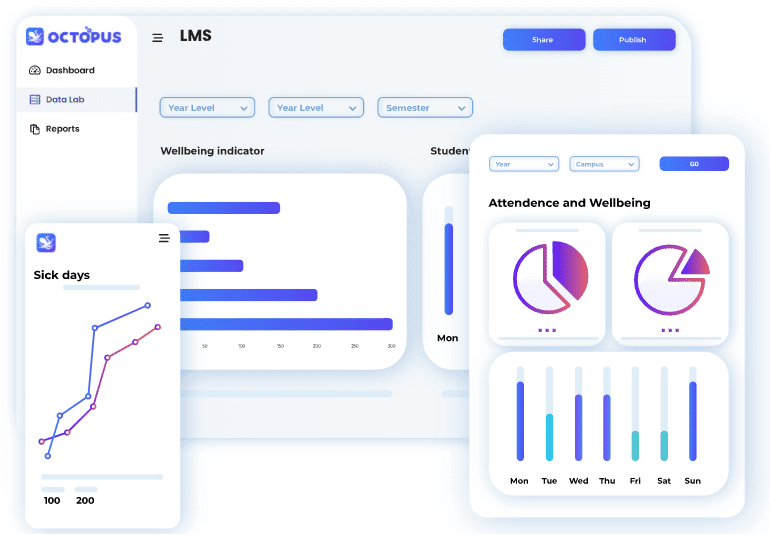
Holistic student dashboards comprise every kind of data visualization, and can be customized to an institution’s needs. From bar charts, line charts and pie charts to scatter plots, you don’t have to be a data analyst to see patterns and trends in clear data visualizations.
With visualizations, numbers can be transformed into actionable insights, creating real value from an otherwise dormant business asset.
That value comes in the form of smart strategy and decision-making powered by data science.
Advances in educational technology (EdTech) already benefit millions of students and thousands of workplaces in the future of work and the future of learning.
EdTech solutions can assist providers to improve critical areas such as compliance with legislation and national standards, student completion and graduation rates, and student experience, engagement and wellbeing.
Compliance with standards and legislation
The education sector as a whole is undertaking significant reforms when it comes to the operations of education providers. From schools to workplaces to VET facilities, the sector is seeking to build self-assurance, consistency, collaboration and importantly, continuous improvement, and they are using EdTech and data to do so.
National standards and legislation have been put in place to give stakeholders confidence in the integrity of education providers and the caliber of the qualifications they provide. In order to provide top-quality education to students in all disciplines as education evolves, providers must comply with the process of performance assessment and improvement (formerly known as audits).
However, both the process of complying with standards and legislation, and the process of performance assessment to ensure compliance, can be expensive and time-consuming, leading to challenges in attracting and retaining students and staff, and executing education requirements.
To ensure education providers are able to assess themselves on an ongoing basis, data analytics platforms help organizations manage compliance and risk over time.
EdTech platforms can help drive down the cost of compliance and assessment by making it easy and fast to collect, manage and see data on students and operations. This increased visibility helps providers actively improve their own practices and have confidence in their own compliance, performance, and other factors that vocational education providers need to stay on top of.
Enrolment and completion rates
Vocational education and workplace training programs are under pressure to adapt to and take advantage of evolving digital technology in the education space. This pressure is created by the need to remain competitive and profitable in business, as well as provide quality education, all together with the goal of attracting and retaining students and teaching talent.
It’s incredibly important for VET providers to both attract new students, and ensure that their existing students are on track to complete their courses successfully.
VET qualification completion rates data from 2019 shows 43.4% of all VET courses started in 2016 were completed, compared with 42.9% of qualifications started in 2015.
While it’s great to see a small increase, unfortunately that’s still less than half of commenced qualifications completed in the expected timeframe, and government data suggests a longer-term decrease since 2015.
Low graduation rates cost institutions money and resources, and weaken their ability to meet the needs of the market and their other students.
Attrition and retention are complex issues across the education industry. In order to lift these rates and help more students attain positive outcomes, edtech software collecting data about students, staff, providers and courses can be used in analytics methodologies to monitor and flag key factors that impact completion rates, like:
- Academic preparation, attendance and engagement with materials
- Demographic, financial and environmental factors in students’ lives
- Mental health, disability and chronic health issues
- Work and study balance
By collecting, tracking and visualizing student data across a wide variety of factors, VET providers, teachers and even students themselves can gain greater visibility over a student’s educational journey. They can also intervene when the data flags potential risk of failure or dropout in a student’s behavior, academics or support needs.
Early engagement and early intervention are critical for getting students back on the right track.
Ideally, every student should have the support they need to successfully complete their studies. Data analytics and visualization solutions are a great tool to assist in figuring out which students need what kind of support, and when.
Developing insights from data is important – being able to take action based on those insights is even more important, especially when it comes to retention and attrition.

Student experience, wellbeing and engagement
A variety of factors influence a student’s ability to engage with their studies, and engagement is critical to student success. Student engagement has a large body of research in education. There are many factors that can be monitored and visualized to assess a student’s engagement with course materials and classroom discussions, whether virtual or in-person. A few examples include:
- Time spent with the materials
- Test scores
- Interactions with others
- Self-regulation of study behaviors, and more.
Monitoring and improving student experience and wellbeing is an increasingly necessary endeavor in vocational education and workplace training, but also one that requires a greater volume of data collected and analyzed.
From student preparation, to enrolment, to orientation, data visualizations can assist educators with understanding which students are ready, happy and motivated, and which need more support to start their studies strongly.
Beyond orientation, student experience extends through the classroom (physical and virtual), and outside it. How students engage in class, in the wider institution, and outside the study environment can all affect their achievement outcomes.
Career planning and life preparation, academic, income and psychological support, and catering for diverse students with diverse needs can all improve learning, student experience, wellbeing and eventual success on both a group and individual level.
Integrating business critical systems, like a student information system (SIS) or a learning management system (LMS) with a learning analytics solution allows a VET provider to access and interpret data on an individual student scale, and much more broadly – and, most importantly, in close to real time. Six months might be too late to stage a successful intervention when a student is in need.
But continual data collection and analysis in a student dashboard, for example, allows educators a quick glance at what’s happening with their students on a daily or weekly basis.
Beyond a holistic student dashboard and profile, custom data projects can be developed around any number of factors. For example, matching international students to the right accommodation can be a huge benefit to the student’s quality of life, wellbeing and ability to engage with their studies.
Data analysis has a reputation for being anonymous number-crunching. But the truth is quite the opposite. With strong data strategies, students can be profiled as individuals, rather than faces in a crowd.
Developing student or learner profiles that unite an array of factors gives teachers and providers clear, evidence-based knowledge of a student’s achievement, development, and their level of potential or risk – information that can then be acted upon before it’s too late.

The future of data analytics in vocational education and workplace training
Data analytics and visualizations are already providing vocational and workplace education systems with immense value in critical areas like compliance, completion rates and student engagement.
It’s about more than collecting data – it’s about using that data to its full potential as a business asset, to the benefit of providers, teachers and students. It’s about improving the end-to-end student journey and experience with data-backed proof about what you’re doing and why you’re doing it.
As we continue to advance and recover from the impact of the COVID-19 pandemic, Australia will need even more new ideas, new skills and new jobs to power our economic, social and academic goals.
In order to pursue global excellence and competitiveness, data analytics will play an increasingly important role in the strategies and decision-making of providers, teachers and students in vocational and workplace education programs around the nation.