
The changes that have been made to the way we deliver education over the last 18-24 months have been significant.
The adoption of online tools has been prolific. The migration of teaching practice to support blended and full-time online programs has likely pushed forward the agenda of the future of education for many Australian schools and school students in the last two years, much faster than in the previous five or six.
Moreover, schools feel like they’re sitting on a goldmine of data – and data tools. These tools create many data-powered opportunities for everyone, from private and public schools in K-12, to higher education and vocational and workplace training institutions.
Historically however, data has been challenging to leverage, because it’s been buried inside the tools, difficult to access and even harder to cross-reference. To make the most of the gold they’re sitting on, schools therefore engage in data aggregation and visualisation projects using both their own data and national education statistics – but there are challenges here, too.
Statistically, big data projects tend to fail. The drivers for successful data projects are:
- the strategic vision of the included schools (a clear identification of the data project and a strategy about how to get there)
- a recognition that over time, we will identify more data collection gaps, holes that we can fill through universal collection strategies that are aligned towards that outcome
- Adequate Institutional and Vendor staffing, resourcing and project management
- a partnership with data experts who deeply understand how to deliver what you need
Opportunities and challenges in education data

Digital ecosystems of tools are expanding. Software has become easier and faster to deploy. This is something that schools and other education institutions once had to spend a lot of time doing!
Furthermore, there are core tools that sit inside of schools and school websites which are maturing and being invested in. There are additional layers of instructional design tools and other point solution type tools that schools are acquiring at speed. All of which fill different needs.
However, as we continue to invest in complex digital ecosystems, each new tool represents new data. It’s becoming increasingly difficult and time consuming for teachers and leaders to get an accurate picture of different students and cohorts holistically.
For example, if a teacher wanted to look at a certain number of individual students attending a government school in New South Wales and compare their performance across:
- SIS data
- LMS data
- external benchmarking data like NAPLAN
- wellness data
- and attendance, financial or other enrollment data…
…whilst all the above data exists, the amount of time and effort it takes to find and aggregate that data into one picture is simply impractical to do manually, especially at scale for an age group or over a series of years – and especially in continuous, real time.
A staff member may not have the skill to do this. They may not have the time. Even if they have the skill and the time, they still need a specialized tool to pool the data and create a visualization from it – and within three to six months, or even weeks, that data is already out of date.
Another challenge for institutions is that depending on school-wide policy and approaches to the data that’s being collected, visualized, and distributed, it can become a governance risk. People download free trials of things and import live data – real, true, personally identifiable student or school data – into free trials, visualizing things and even sharing it onwards. Learning analytics tools should help mitigate risk, not cause it!
Key aspects of an education data strategy

While individual learning tools may surface a small amount of their own data, inside of the service, this can often be limiting.
For example, inside an instructional design tool or a Learning Management System, there may be an analytics page that you can view. But it will only show data from that tool. How fresh or real-time is that data? How is it calculated? And how and where do you integrate that into your other tools to visualize or compare those results?
Individual schools are very interested in ‘live’ data, and the EdTech industry is gradually growing more advanced in allowing live connections to data. The main thing that explains how ‘live’ your data is, is the extraction method used to collect it from the tool or database it sits within.
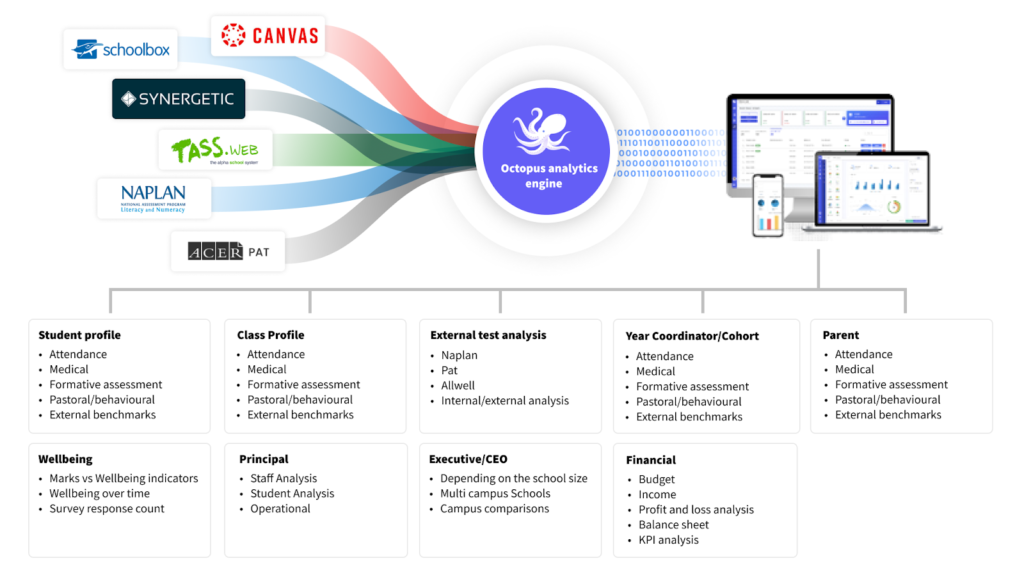
- Sophisticated tools allow an increasing number of API connections, which essentially are live questions between programs. For example, the Octopus BI platform can ask tools with which it has API access to extract an answer securely, bring that data in, and incorporate it with other data sources.
- ‘Mission critical tools’ schools use that sit on top of databases can be queried directly, and we can write very complex queries to pull the data out that a school needs.
- Finally, we can also use direct data imports, or tools that provide exports such as in a .CSV or an Excel file. For example, when it comes to things like NAPLAN, that data is generally extracted once a year, via a .CSV or a flat file transfer.
Sometimes, the calculation side of data visualization is hidden from a school to reduce complexity, but we believe calculation models and algorithms should be transparent.
For example: when we’re talking about calculating engagement, we measure X, Y and Z, with these weightings. Admins at the school can then switch on and off the different toggles to remove or add different variables.
This is very valuable for increasing understanding and control of data.
Once you’ve extracted and visualized data, where do you put it? Adoption, and frictionless access for staff, is a key consideration for schools. People must be able to access critical data in a way that’s frictionless for them, or in a way that supports an existing business process at the school, such as within a Learning Management System.
Tools like Octopus BI can support all this at once, providing a single platform for all data sources to connect to, with the output stakeholders expect, can access, and understand, such as in school and student dashboards and learner profiles.
With access such as this, an institution’s data strategy can then mature and turn to how to grow the connectivity of systems to make it easier over time for schools to connect to and extract that data, and even integrate new sources seamlessly. Once a school can confidently access and interpret their data, they can then make much better data-informed decisions on key areas like student retention, growth and success, and filling business needs.
Unification and visibility of data is a huge benefit for institutions and teachers. It provides stakeholders with insights that go beyond the traditional. It can help educators to get a sense of:
- What do I want to know?
- What is the data actually telling me? Is it easy to interpret?
- What do I do about it?
- Where do I need to focus my efforts? Where do I need to act?
Once you have some answers to these questions, you’ll have a much clearer picture of where you’re at and where to focus your time on. By consolidating the information and insights sitting inside your education tech stack, you will streamline your analytics efforts for good.